Got WiFi? Free App Helps You Meet Basic User Need
Did you hear the one about the teacher who asks a group of students to name something they need but can't see or feel? The hip-hop loving, smart-gadgets sporting, what's-apping generation answer in unison, "WiFi." Increasingly, WiFi is becoming indispensable and, apparently, a candidate for inclusion in Maslow's hierarchy of basic human needs.

Mobility has altered the way we do business. The lines between work, home, and social life are fading fast. Businesses must therefore be diligent in deploying and managing WiFi networks as more and more people rely on connectivity to get work done.
There is just this one problem, though. WiFi is everywhere but still nowhere. Surely, you've paced the floors and corners of your home or office in search of that spot where you really get the best signal. One of the common complaints an IT admin receives from end users concerns 'poor' or 'slow' WiFi.

So how can businesses ensure good WiFi connectivity? In part, by understanding the hurdles that lead to weak signals and, in turn, lower the bandwidth over the network. The hurdles include:
- Too many WiFi networks nearby
- Channel interference
- Improper placement of repeaters or access points
- Lack of tools that provide a holistic analysis of the WiFi network
To tackle these issues, IT admins need an effective tool like the ManageEngine WiFi Monitor Plus. This free diagnostic app for Android devices provides key insights about your WiFi network including the signal strength, the channel interference, and coverage. It has both Analyzer and Surveyor modes, making it the first WiFi monitor to offer both modes in one app
In the Analyzer mode, WiFi Monitor Plus lets you view the following:
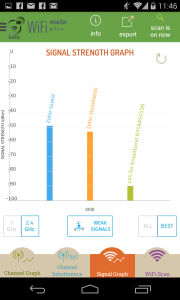
- Signal Strength - a single graph of available WiFi signals, with weak signals filtered out by default.
- Channel Graph - a quick guide to the channels on which WiFi networks are deployed.
- Channel Interference - a graph that clearly demarcates co-channel and inter-channel interference.
Using the Surveyor mode, you can:
- take stock of signal strength at different locations in a site,
- upload your own floor plans and survey WiFi signals,
- visualize signal spread by using the heatmap, and
- export and email reports or store them either on the device or on Dropbox.
The WiFi Monitor Plus includes the Channel Graph Widget, which you can add to the home screen of your device for instant access. The app provides you actionable data that helps optimize the signal strength of the WiFi networks. For instance, you can ascertain the channels that must be switched off due to interference or the expected versus actual placement of access points.
The app comes with smart filters that show signals with the best strength and by frequency range. It intelligently filters out the weak signals, making the interface clutter free.
A beta launch to a closed group of users had some interesting feedback. Here is what a couple of them had to say:
Charlie Smith, Technical Director at Charles Dhekelia Ltd:
“ Good app! I used WiFi Monitor Plus! to quickly map out our WiFi setup, and enjoyed using the function to see which APs were interfering with others. I have previously used 'WiFi Analyzer' for jobs such as this, but the ManageEngine solution does provide a lot more functionality and granular detail, which is definitely useful to have.”
Chris David, Solutions Implementation Specialist at Enterprise Bank & Trust:
“One of my favorite features is that I can set the analyzer to show me all networks, or just 'best' networks. This is actually really handy if you are in a 'noisy' area. Kind of hard to make heads or tails of the data when there are several networks that are just barely in range clogging up the graphs. I also like in the wifi scan all the details you can get. We're IT - we love details!”
So while we wait for trees to give off WiFi, download and give WiFi Monitor Plus a try.
PS: Originally published here.