Common SQL Server challenges and how Applications Manager's SQL Performance Monitor helps you overcome them
Database management systems are an essential component of business applications. Over the years, MS SQL has earned its place in the hearts of database administrators (DBAs) as the most trusted relational database management system. It is still the go-to choice for many DBAs as it helps them leverage its extensive capabilities across various dimensions such as security, portability, transaction processing and analytics.
DBAs face tedious challenges on a daily basis to ensure optimal performance of databases in their network. Database downtimes can cause revenue loss, reduce productivity, negatively impact brand reputation. It is pivotal to employ a SQL server performance monitoring tool to ensure the security and availability of your critical data and seamless application performance.
Read on to learn how ManageEngine Applications Manager's SQL Server Performance Monitor can help you overcome some of the most common database hassles.
Ensuring uninterrupted database server availability
The most effective way to provide seamless application performance is to ensure uninterrupted database server availability. Database downtimes can cause revenue loss, reduce productivity, negatively impact brand reputation. Downtimes can also promote poor digital experiences, frustrate users, resulting in low user satisfaction scores.
With Applications Manager's tool for SQL performance monitoring, you can proactively monitor three crucial MS SQL operations to reduce downtime.
- Database Mirroring: You can detect synchronization problems and receive instant alerts by constantly monitoring database mirroring sessions and logs.

- Replication: You can monitor the status of replication agents to ensure replication processes are running without any hiccups. You can also track the status of publications and subscriptions. To prevent accidental data loss, you can identify and fix out-of-sync subscriptions by tracking their Expiration Status.
- Always On Availability Groups: You can monitor availability groups, their corresponding replicas, and even detect differences in data sync between primary and secondary databases. This is done by tracking Redo Queue and Log Sent Queue. Also, by discovering fail-over readiness, you can analyze the possibility of data loss during a manual failover.
Implementing a powerful backup-recovery routine
Even with extensive monitoring and management, crashes and database failures occur due to reasons beyond control. It is imperative that your SQL performance monitor can help you implement an effective, fool-proof backup and recovery routine. With Applications Manager, you can configure backup job schedules at your preferred frequency. This means you can restore data, even without logging into SQL Server Management Studio, when an unexpected failure occurs.
You can instantly detect when backup jobs fail, and you can analyze the cause of failure, resolve it, and promptly improve database server reliability. With Applications Manager's SQL performance monitor tool, you can even identify damaged backups and ensure they are fixed or replaced. The timeline and age of the backups are also tracked to ensure continuity in your backup schedules.

Combating cloud database migration issues
With many businesses now looking to deploy their databases to the cloud, it is important to ensure that your SQL server monitor helps you migrate with confidence. With Applications Manager, be better equipped for the migration process by tracking crucial cloud database performance metrics such as DTU usage, R/W utilization, lock details, and blocked queries in both Azure or Amazon RDS cloud environments.

If your IT infrastructure has a hybrid cloud environment, Applications Manager has you covered. You can monitor on-premises and cloud databases—all from the same console.
Discovering optimization opportunities to amp up database server performance
Battling continuous database server performance issues can leave database administrators frustrated. Applications Manager's SQL Server Performance Monitor can identify optimization opportunities to help enhance overall server performance.
You can track important memory-related performance metrics, such as Total Memory, Lock Memory, and SQL Cache Memory, and receive alerts instantly during memory surges. You can analyze slow-running queries, identify the root cause of slowness, and tune them accordingly to enhance database performance. You can even gain insights about frequently executed queries, and the most blocked queries along with their average execution time.
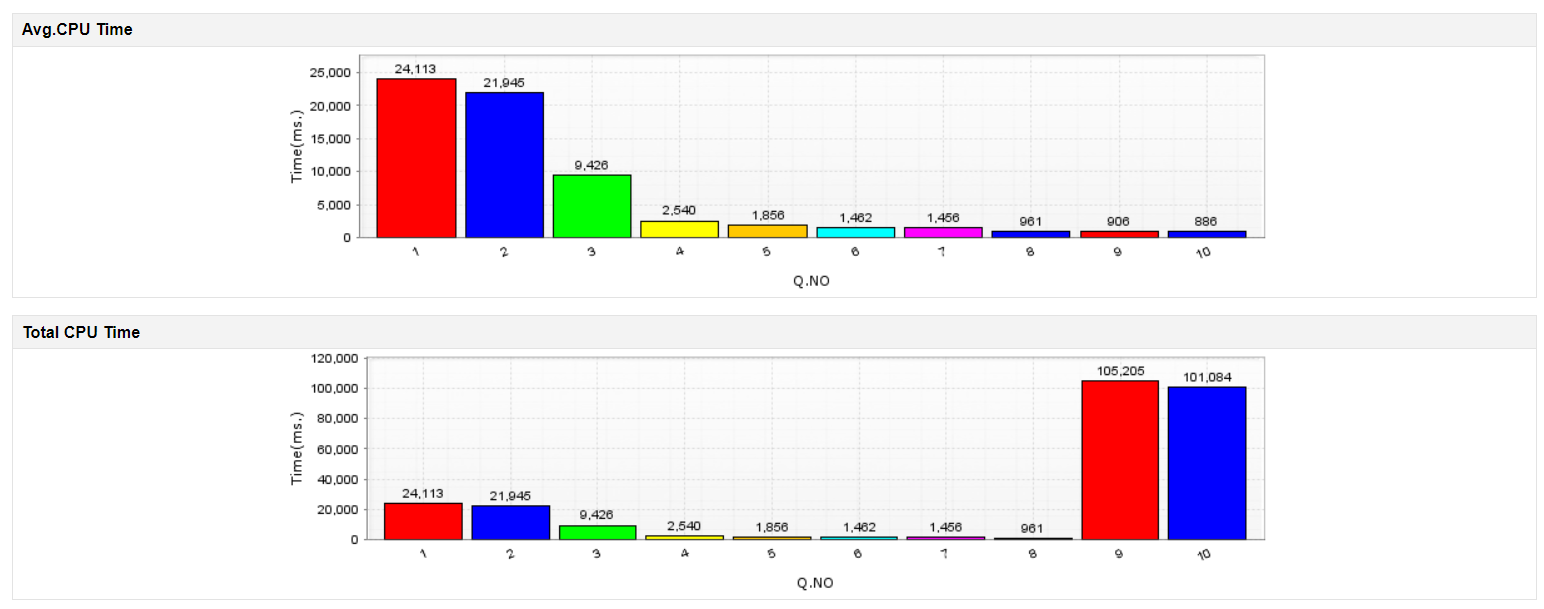
Applications Manager's SQL performance monitoring capability also enables you to identify queries that are over-utilizing the CPU so you can tune them accordingly, thereby reducing transaction latencies. Insights about Average CPU Time and Total CPU Time can help you get an overview of resource utilization in your MS SQL database server.

If you are looking to deploy a proactive SQL performance monitoring software, download Applications Manager now!