JMX monitoring 101: From basics to best practices
In today’s world of distributed, cloud-native Java applications, keeping systems reliable, scalable, and high-performing is more critical than ever. To achieve this, development and operations teams rely on observability tools that offer deep insight into how applications behave in real-world conditions. One of the most effective ways to achieve this in Java environments is through Java Management Extensions (JMX) monitoring.
In this blog, we’ll explore what JMX monitoring is, why it’s vital for modern Java applications, the challenges you might face, and the essential metrics and best practices to ensure you get the most value from it.
Understanding JMX monitoring
JMX monitoring is a method used to observe, measure, and analyze the runtime performance and behavior of Java applications. By leveraging components called managed beans (MBeans), JMX exposes the detailed internal metrics and operations of the Java Virtual Machine (JVM). These MBeans communicate with the JVM’s built-in MBean server, enabling teams to track data such as memory consumption, garbage collection (GC) statistics, thread usage, and even custom, application-specific metrics. This real-time visibility allows engineering teams to identify performance bottlenecks, tune applications, and troubleshoot problems without requiring downtime.
Why JMX monitoring matters
Effective Java application monitoring using JMX offers both operational and strategic benefits. It helps you detect and diagnose problems like memory leaks, prolonged GC pauses, or thread contention issues before they affect users. Beyond JVM health, JMX monitoring can also track business-critical metrics like transaction counts, queue sizes, and cache performance. This aligns technical performance with business goals, helping ensure that your Java applications remain efficient, resilient, and responsive to users.
Common challenges in JMX monitoring
While JMX is a powerful observability tool, there are several challenges teams often encounter with it:
Security concerns: Exposing JMX endpoints without proper encryption or authentication could allow unauthorized users to access sensitive operations.
Too many metrics: The JVM can generate hundreds of metrics. Without a focused approach, dashboards can become cluttered, making it hard to see what truly matters.
Resource overhead: Collecting metrics too frequently or from poorly optimized MBeans can add an unnecessary CPU and memory load to the application.
Complex integrations: Sending JMX data to modern observability platforms like Prometheus, Grafana, or cloud-native APM tools often requires extra configuration and custom connectors.
A lack of context: Raw JVM data alone can’t always explain why an issue happened; it’s best to combine it with logs and distributed traces for comprehensive root cause analysis.
Key metrics to track with JMX
To maximize the value of JMX monitoring, prioritize metrics that directly influence application health and the user experience:
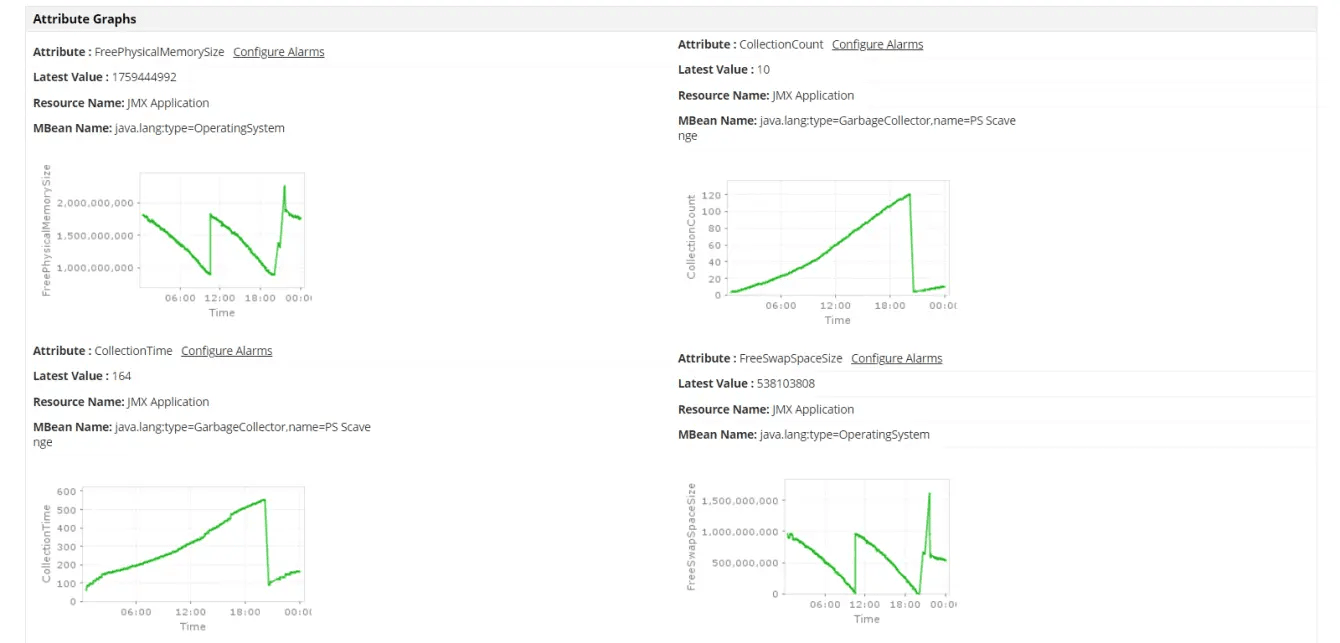
Memory usage and GC statistics: Monitor heap and non-heap memory usage, the GC frequency and duration, and old generation usage post-GC to identify potential memory leaks.
Thread counts and concurrency: Track active threads, the peak thread count, daemon threads, blocked or waiting threads, and JVM-reported deadlocks.
Class loading counts: Watch the number of loaded classes and the total number of loaded and unloaded classes over time to detect anomalies.
Custom application metrics: Use MBeans to track queue sizes, cache hit ratios, the number of active sessions, and transaction volumes—metrics closely tied to your business operations.
Connection pool metrics: Monitor active versus idle connections, wait times, and pool usage to maintain healthy database and messaging system interactions.
Best practices for effective JMX monitoring
To build a sustainable, actionable JMX monitoring strategy, follow these key recommendations:
Prioritize actionable data: Focus on metrics that reveal meaningful trends and application health rather than collecting everything by default.
Combine metrics with logs and traces: Link JMX metrics to logs and distributed traces to add context, enabling quicker, deeper troubleshooting.
Secure your JMX setup: Protect endpoints with encryption, enforce authentication, and limit access to trusted networks only to safeguard production environments.
Blend JVM and app metrics: Monitor both low-level JVM stats and high-level application metrics to see the complete picture, from infrastructure health to business performance.
Set up smart dashboards and alerts: Use intuitive dashboards to track trends and configure alerts based on realistic thresholds to reduce false positives.
Document your setup: Keep records of what you monitor, why, and how your setup is configured to help new team members and ensure consistency over time.
Optimize for performance: Avoid introducing overhead by tuning polling intervals and ensuring MBeans are lightweight.
Adapt as systems evolve: Regularly review and refine what you monitor, add metrics for new features, and retire outdated metrics.
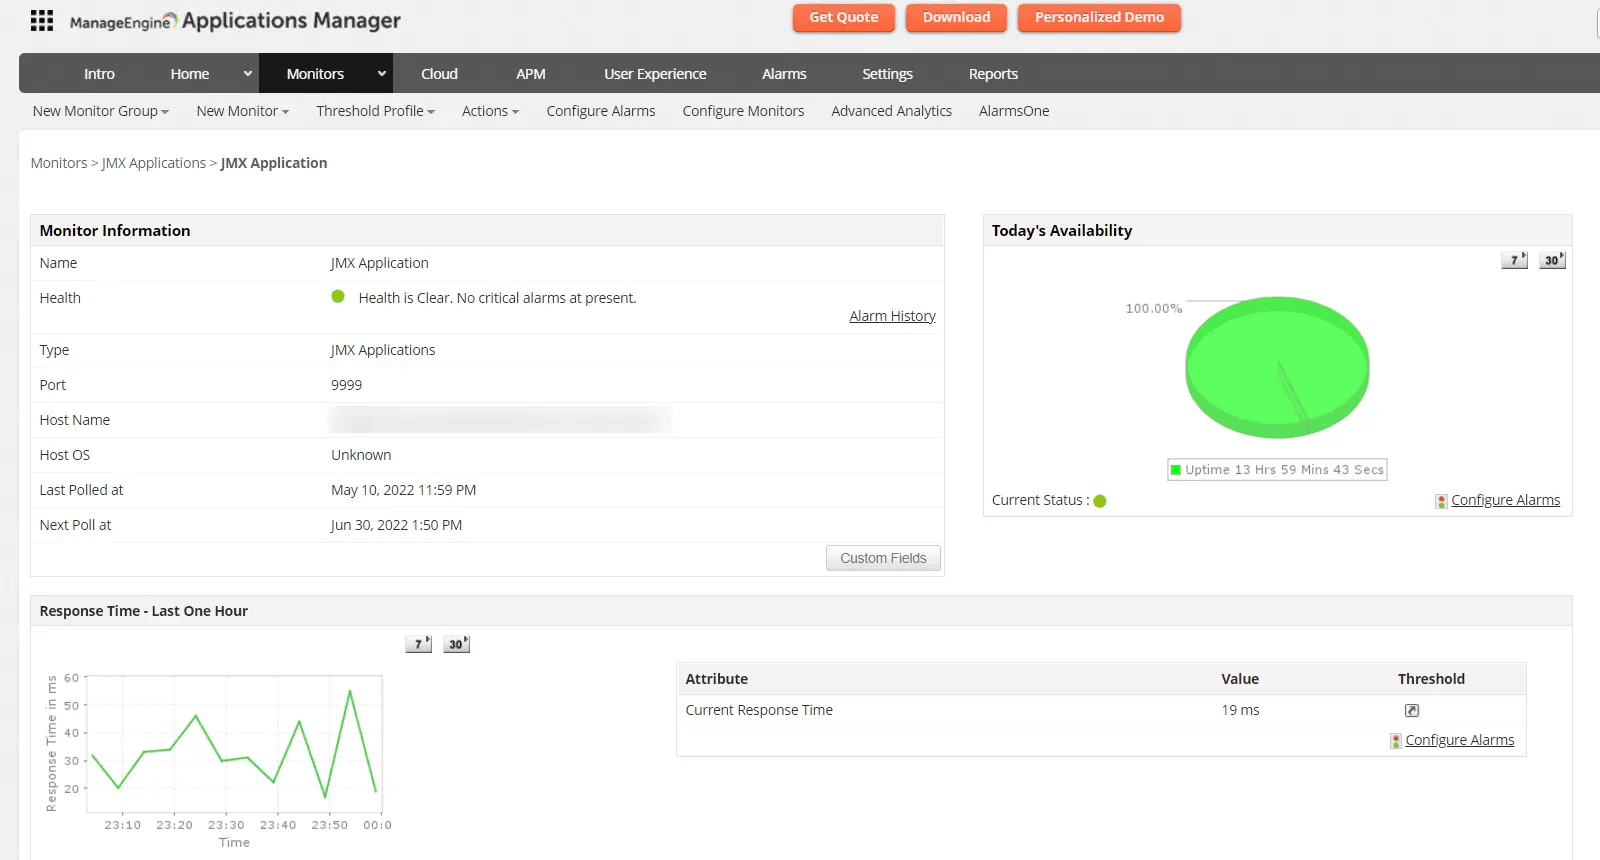
Streamlining JMX monitoring with Applications Manager
Modern Java systems demand proactive, data-driven monitoring to stay performant and reliable. Applications Manager makes JMX monitoring easy and effective by collecting, visualizing, and alerting on both JVM and custom application metrics—all on a single platform. With Applications Manager, you can spot and resolve issues early, track business metrics in real time, and ensure your Java applications run smoothly, even as they grow and change.
Alongside JMX monitoring, Applications Manager offers deep APM for Java applications and a host of other capabilities to enhance your visibility:
JVM health monitoring: Tracks heap and non-heap memory usage, GC activity, threads, class loading, and CPU usage to detect memory leaks, thread issues, and CPU spikes early
Code-level tracing: Uses bytecode instrumentation to provide real-time visibility into transactions, code performance, external dependencies, and errors
End-to-end web and distributed tracing: Monitors full-stack Java and Jakarta EE (formerly known as J2EE) transactions and microservices, visualizing method invocation trees to pinpoint bottlenecks
Thread analysis and deadlock detection: Profiles thread states, captures thread dumps, and detects deadlocks or CPU-heavy threads to help prevent app slowdowns
Database query monitoring: Identifies slow or repeated SQL queries and maps them to Java methods for root cause analysis and back-end optimization
Custom metrics with JMX and MBeans: Enables tracking of application-specific metrics with custom alerts tied to business logic or runtime behavior
Smart alerts and predictive analytics: Provides configurable thresholds, anomaly detection, and ML-powered forecasting to help teams stay ahead of performance issues
A unified dashboard and topology view: Offers centralized visualization, service maps, and dependency graphs across over 150 technologies for complete observability
Quick setup and broad compatibility: Uses a lightweight, agent-based setup that supports major Java app servers like Tomcat, JBoss, WebSphere, and WebLogic
Ready to experience the difference?
Schedule a personalized demo or try our free, 30-day trial today to see how Applications Manager can transform your Java monitoring.