Apache Solr monitoring with Applications Manager
Apache Solr powers search in some of the most performance-sensitive environments: e-commerce, enterprise apps, content portals, and internal knowledge systems. So when latency creeps in or results are inconsistent, users notice. And when those issues go undetected, things escalate quickly.
Apache Solr is built on Apache Lucene and runs inside a Java Virtual Machine (JVM), which means it brings both power and complexity. From indexing pipelines to cache tuning to JVM resource usage, there are many moving parts. That’s exactly why proactive Apache Solr monitoring isn’t a practice that's just nice to do—it’s essential. It helps you identify problems early, optimize performance continuously, and keep the search experience seamless for users.
Why Solr monitoring goes beyond uptime checks
Your Solr service being available does not imply that it is performing well. It could be responding slowly to queries, struggling with large index merges, or running into memory issues without throwing errors.
However, with the right monitoring strategy, you can:
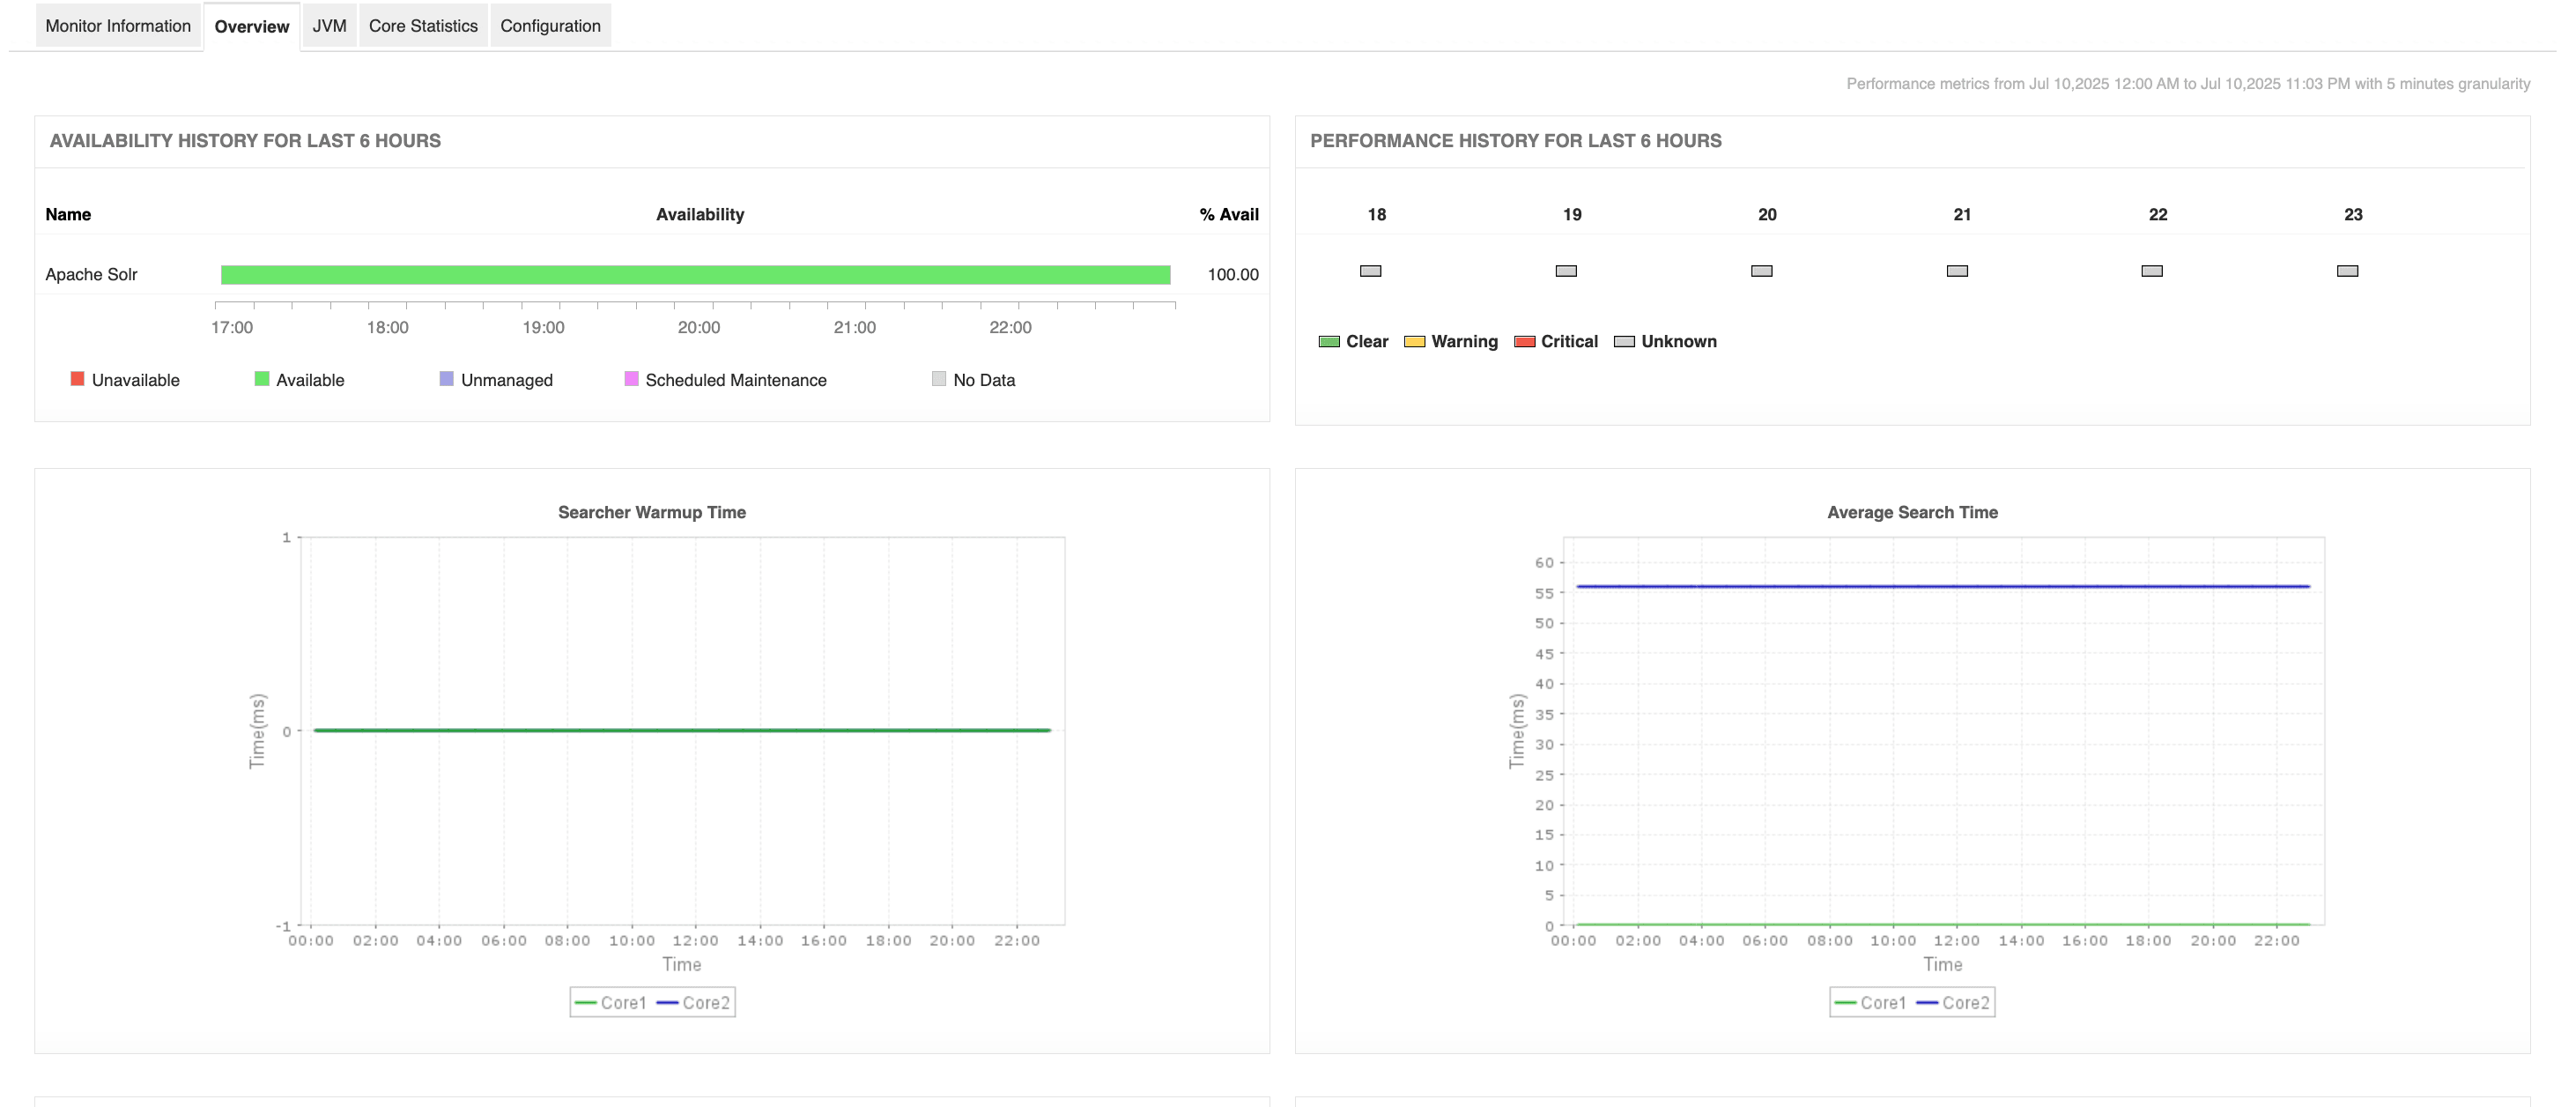
Track query latency and throughput, so you know how fast Solr is responding and whether it’s keeping up with demand.
Monitor indexing activity, including index size growth, update rates, and merge times, which are critical for spotting ingestion bottlenecks and disk usage spikes.
Watch cache performance (document, filter, query caches) to check if caching is affecting query speed.
Keep tabs on system resources like CPU, memory, disk I/O that affect Apache Solr uptime.
Visualizing these key metrics in one dashboard makes it easier to identify what is normal, what’s not, and where things are heading.
Know what happens inside the JVM
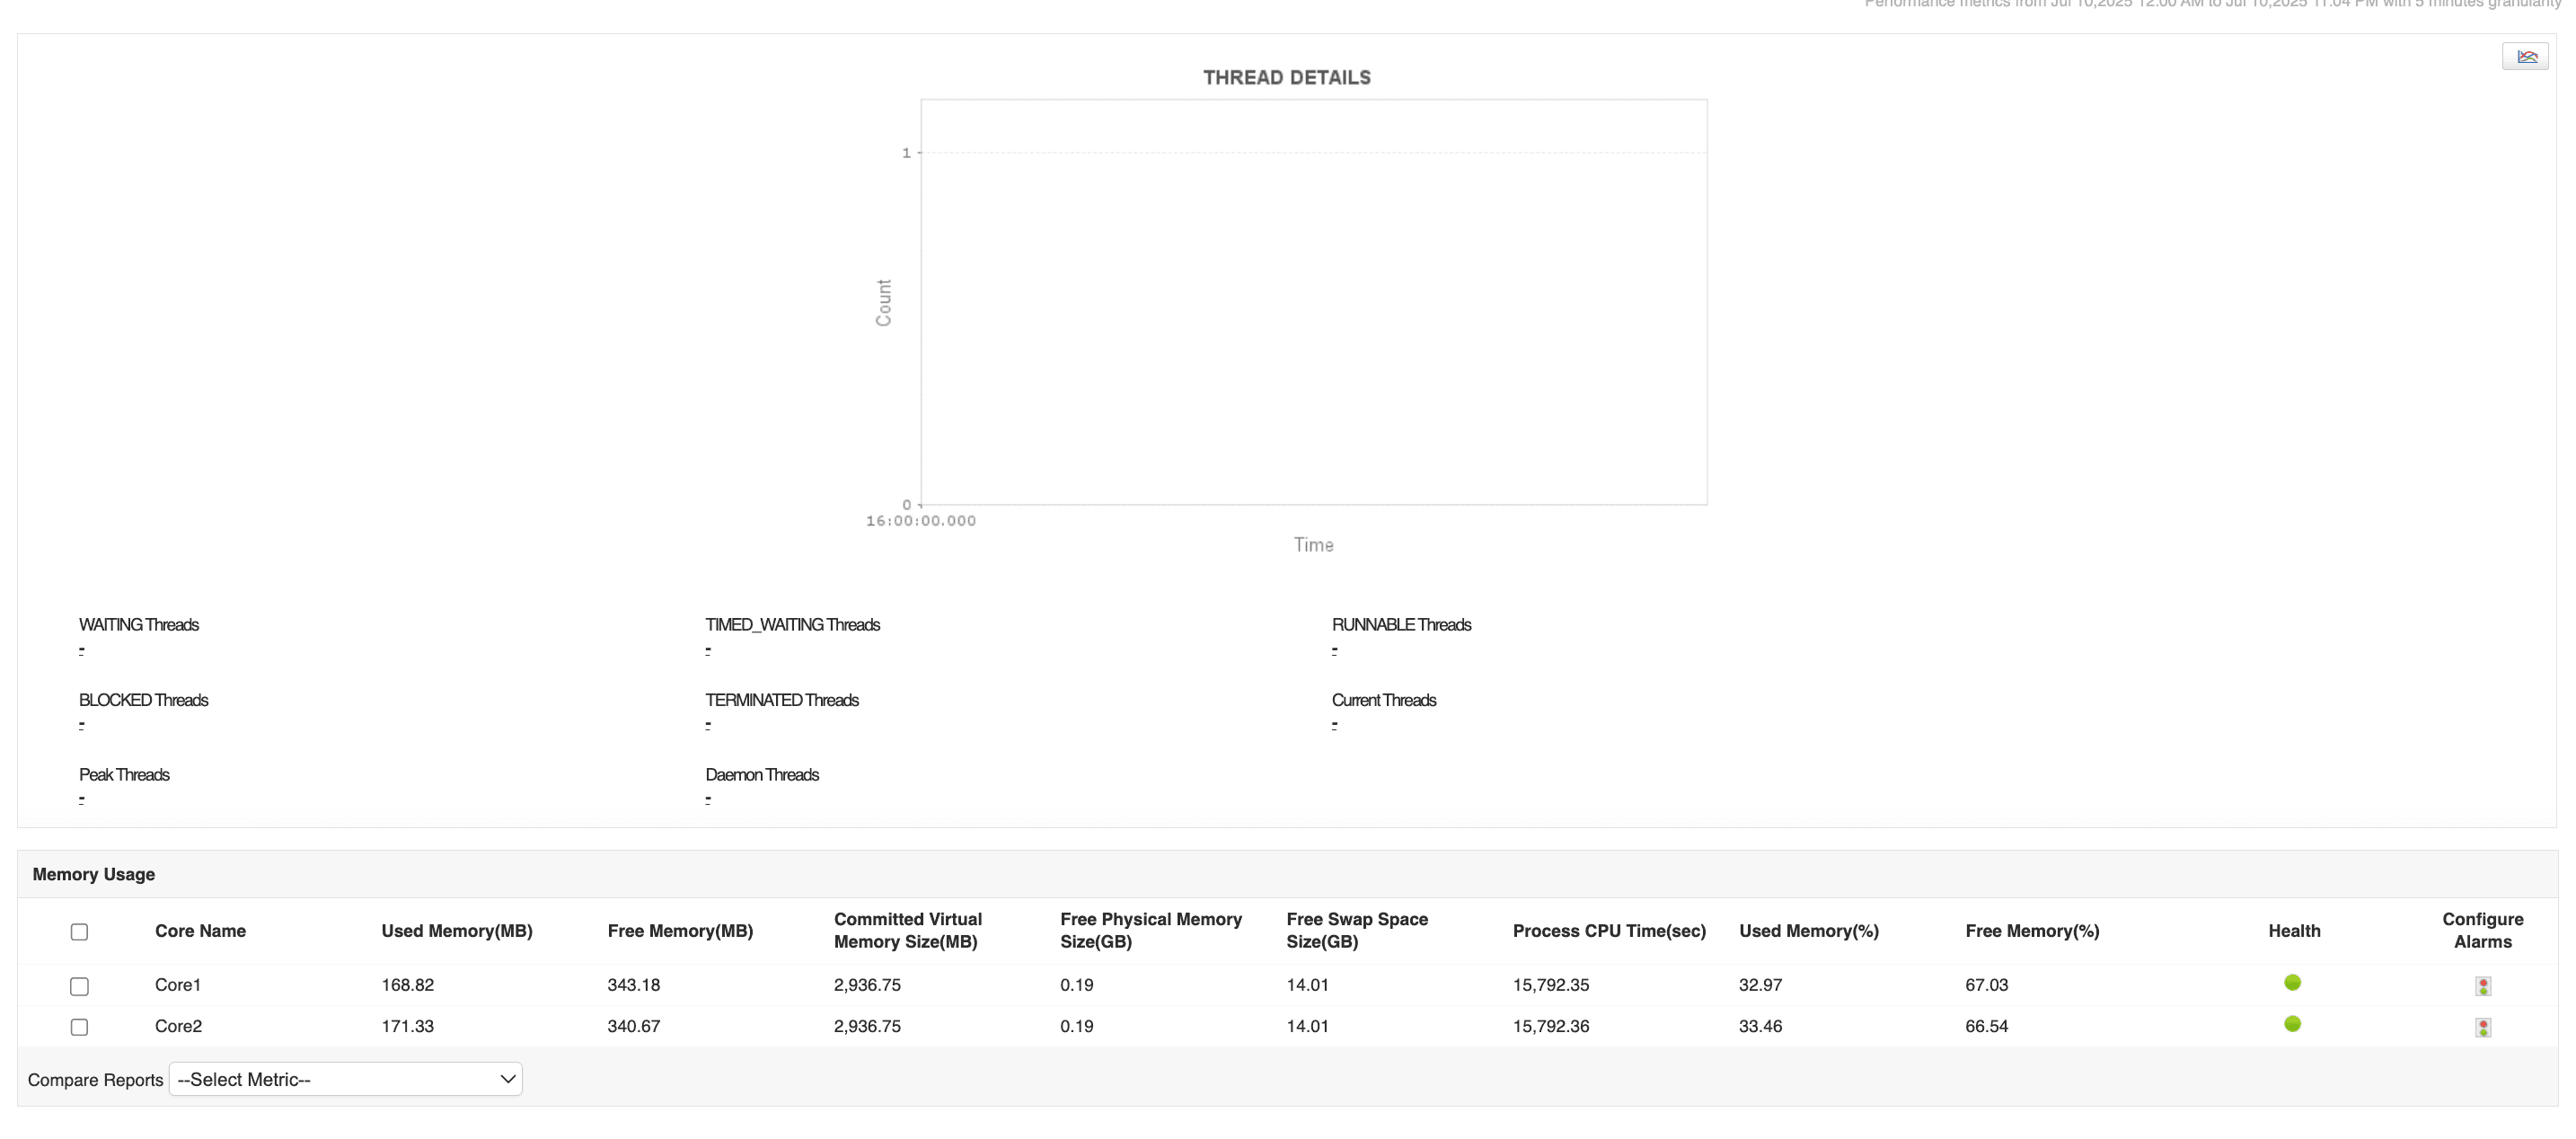
Since Solr runs inside a JVM, your monitoring should include Java internals. Memory leaks, excessive garbage collection, and thread pool exhaustion can quietly erode performance until users start noticing lag—or worse, the service crashes.
Key JVM metrics to track include:
Heap memory usage: Spot leaks or inefficient memory allocation.
Garbage collection activity: High GC times can pause your Solr operations.
Thread pools: If threads are maxed out or stuck, performance tanks fast.

When JVM monitoring is paired with Solr-specific data, you get the full picture—not just what is breaking, but why.
How Applications Manager helps you stay ahead
ManageEngine Applications Manager simplifies Solr monitoring with features like:
Out-of-the-box support for Apache Solr and JVM monitoring
Automatic discovery of Solr instances and nodes
A unified view of query performance, indexing activity, cache usage, and resource health
Historical data and visual dashboards that make it easy to spot trends and trace back root causes
Threshold-based alerts via email, SMS, or integrated ITSM tools, so your team knows before users do
Whether it is a sudden spike in query latency, a drop in cache hit rate, or memory pressure building up inside the JVM, Applications Manager gives you the visibility to act fast and with context.

Here’s what you can do to ensure seamless Solr operations and optimum uptime:
Slow search performance: Check query latency and cache stats to see if request handlers are overloaded or cache sizes need tuning.
Indexing delays: Monitor merge times, disk I/O, and index size growth to spot bottlenecks.
Out-of-memory errors: Use JVM data to trace heap usage trends and garbage collection patterns.
Instead of guessing, you get real, correlated data to guide your troubleshooting and prevent the same issues from repeating. Solr performs an important job, and if it powers anything business-critical, monitoring it isn’t optional. With Applications Manager, you receive the clarity, control, and early warning signals needed to keep your Solr deployment stable, fast, and user-ready—day in and day out.