Exposing Key Performance Metrics through Dashboards in Applications Manager (Part 2)
In part 1 of this series, we explored how dashboards provide an easy way to view the performance metrics of business-critical applications. We also saw the default dashboards available in Applications Manager. In the concluding part of this series, we will take a look at how you can customize these dashboards to showcase performance metrics that suit the unique needs of your business.
Even though the default dashboard, business views, and the availability tab dashboards paint a fairly good picture of the way your applications and servers perform, sometimes you might want to take a closer look at certain other performance metrics. These metrics could be important from the point of view of your business, so you'll need to keep tabs on those metrics frequently.
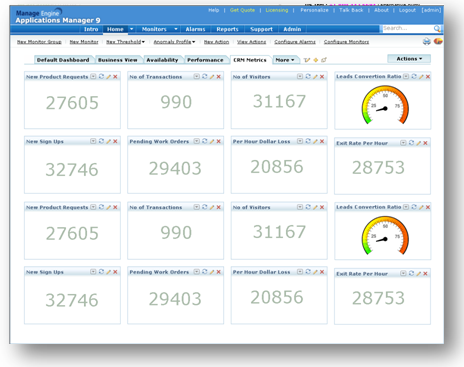
Enter custom dashboards. These are custom views which let you put together metrics of your choice from different monitors. With the help of well-designed custom dashboards, you can provide critical actionable information about your business to the decision makers. They can in turn, make better business decisions with confidence. For example, if your business is running a CRM application, you can view the key performance indicators of the application such as leads conversion ratio, new sign ups, etc. by creating a custom dashboard.
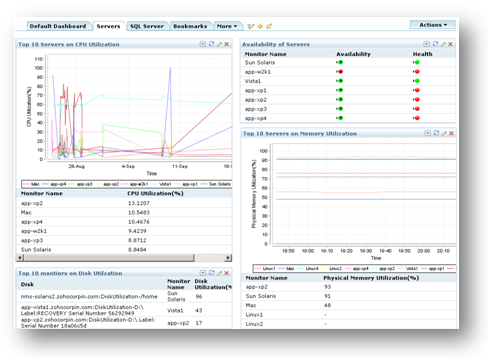
Or if you want to keep track of the health and performance of all the servers in your network, you can create a custom dashboard and add the necessary performance statistics such as the top 10 servers by CPU utilization, memory utilization, disk utilization, etc.
What's more, you can integrate these dashboards in your web portal by embedding a JavaScript code snippet. Refer our online help documentation for more info.