Welcome back to the last part of our three-part blog series on how to leverage analytics to deliver an exceptional end-user experience. In the previous blog, we discussed how analytics can help you identify the process-level inefficiencies lurking in your request resolution process and how you can provide better self-service experiences to end users by understanding their requirements better using analytics.
In this part, we’ll delve deeper into the most important aspect of your service desk—the technicians who provide services to end users—and see how we can make it easy for them to deliver satisfactory resolutions to end users.
Promote healthy competition, and keep your technicians motivated
Always encourage technicians to go the extra mile and provide personalized solutions to end users. Instill a healthy spirit of competition. But make sure you’re using the right set of metrics to measure the performance of service technicians.
Service desks are often brimming with so many metrics that it can be challenging to identify the right set of metrics to track technician performance. As a result, service desks often use only quantifiable metrics such as the number of open or closed requests to measure technician performance.
A better approach is to take a holistic look at the overall performance of technicians. This includes examining not only closed and open requests, but also other relevant metrics such as time taken to resolve requests, number of request reopens, and more.
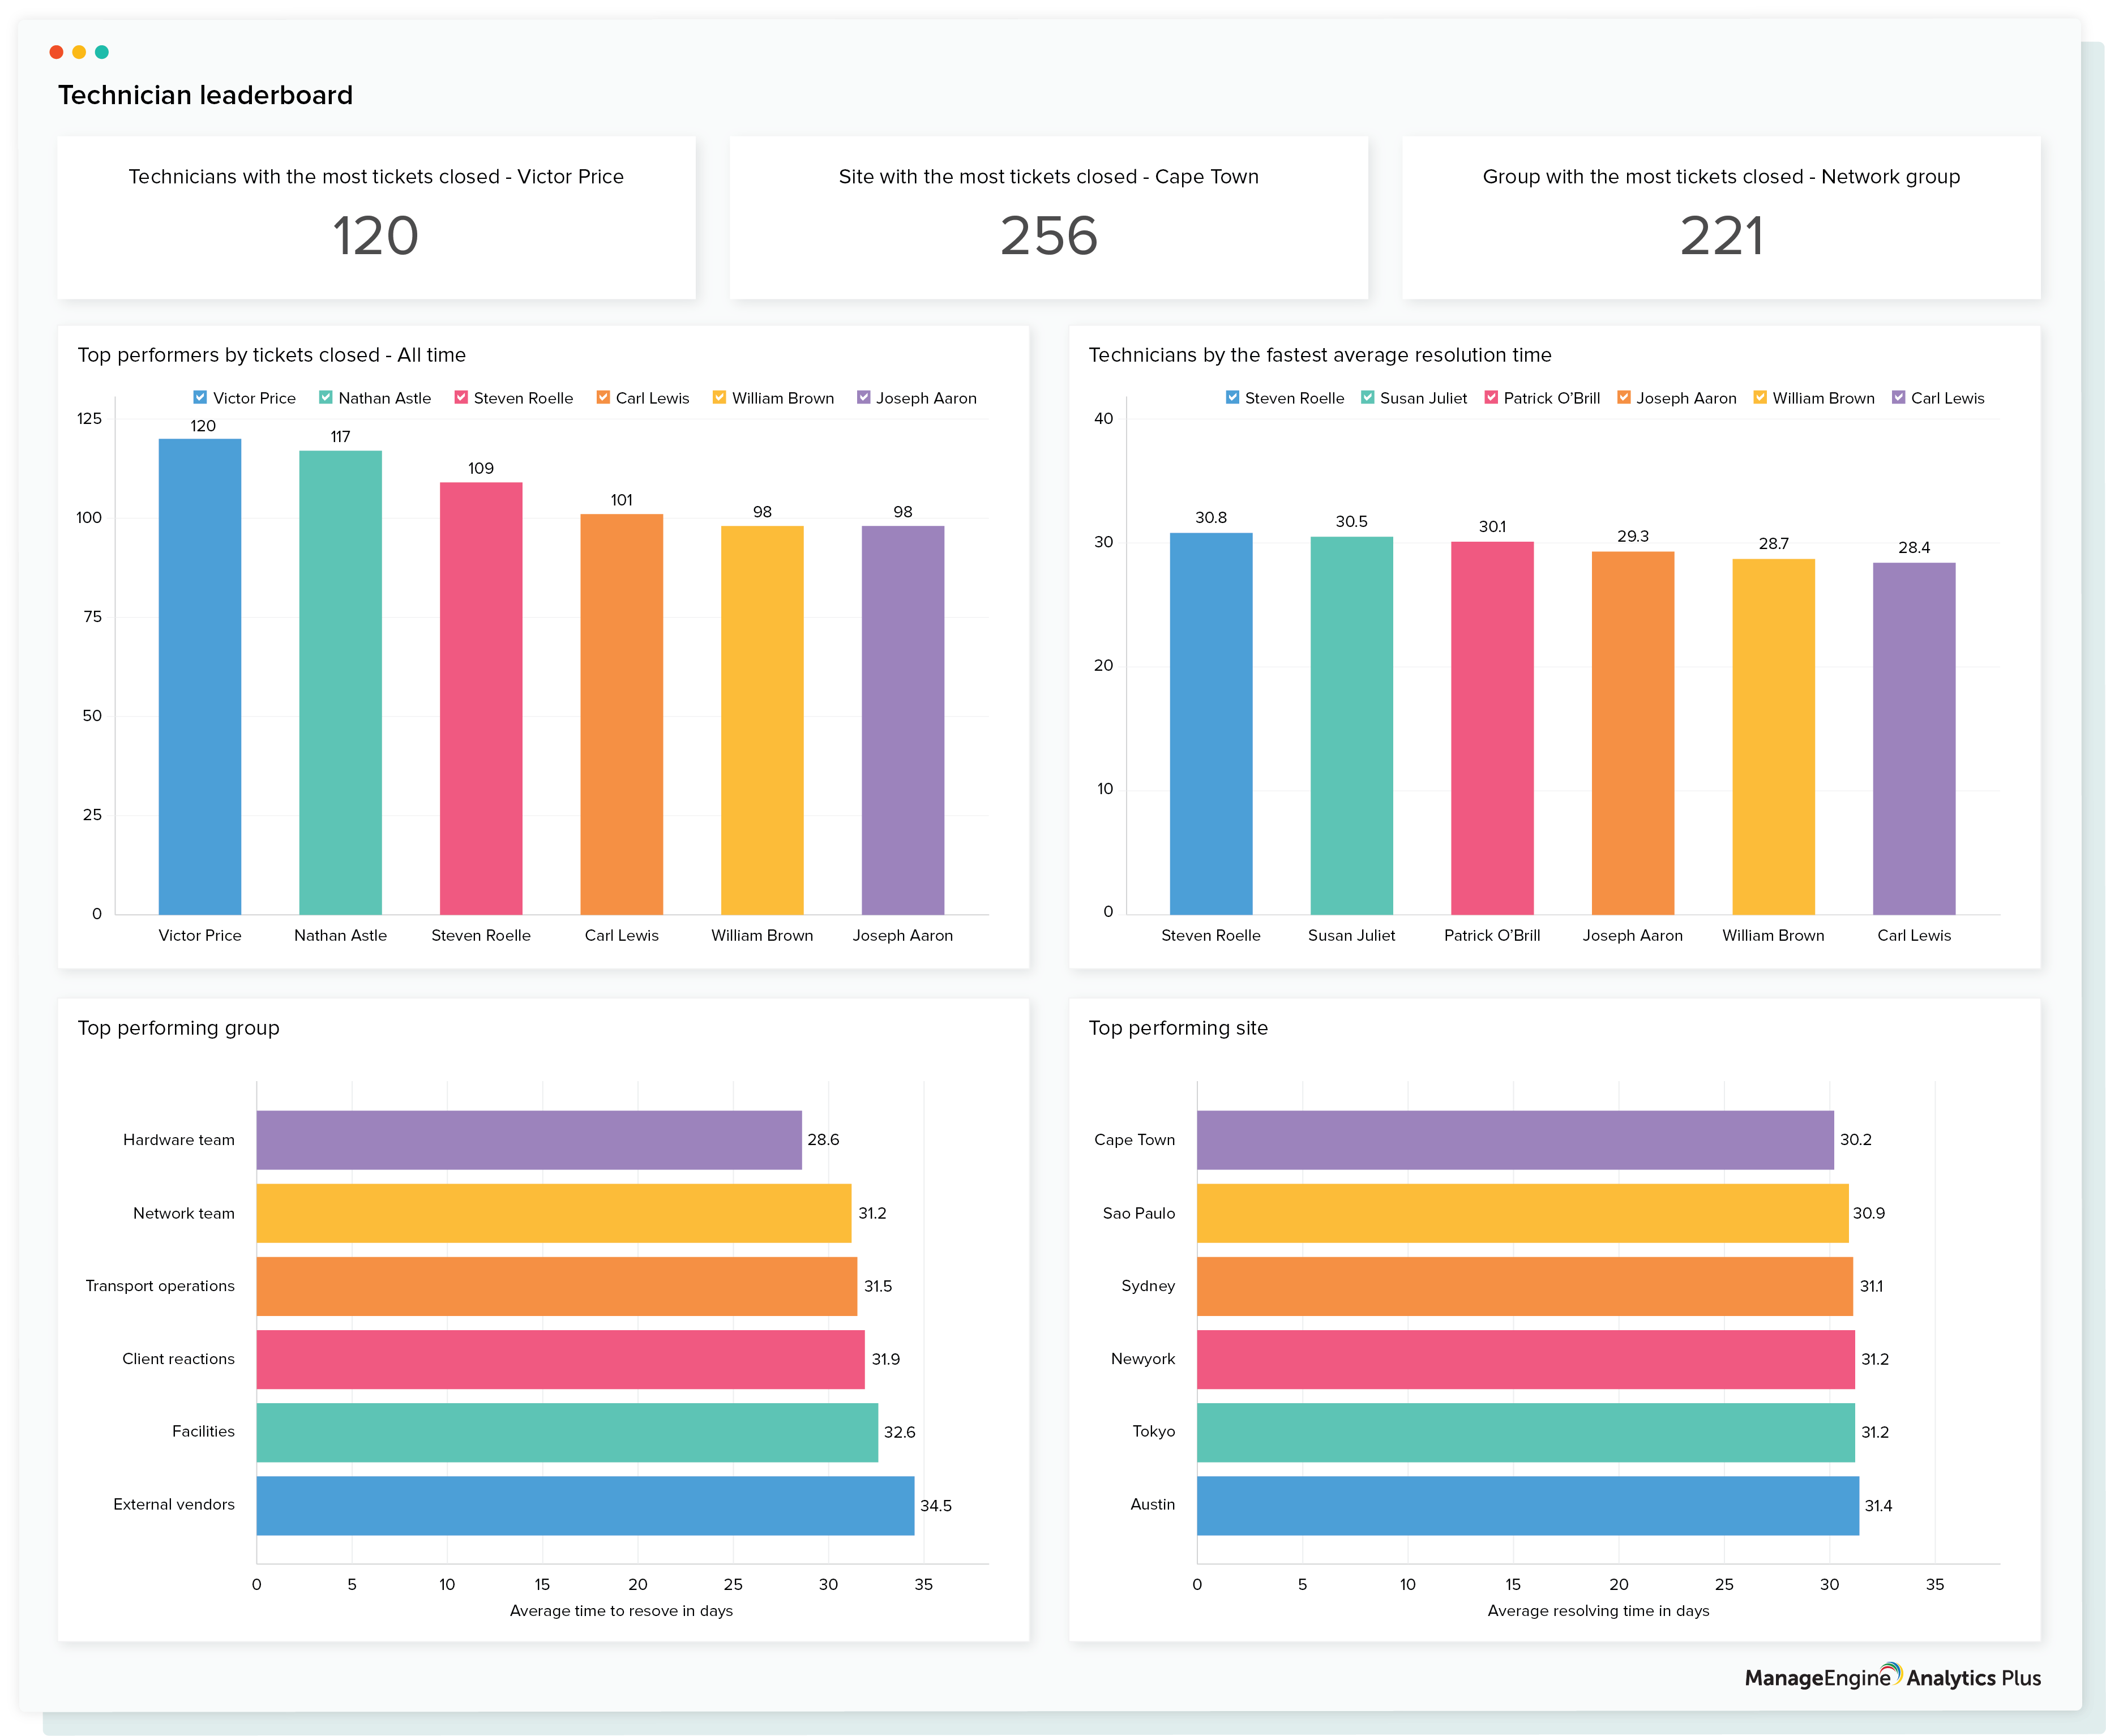
The technician leaderboard dashboard (offered out-of-the-box for Analytics Plus when integrated with ServiceDesk Plus) offers a 360-degree view of technician performance. Comparing the overall performance of technicians promotes healthy competition.
Check out the live dashboard in our demo.
Identify skill gaps early on and train your staff to close these gaps
Clueless technicians can be a nightmare for end users. Explaining their issues repeatedly, having to follow up multiple times, or dealing with technicians who are poorly skilled can seriously impact the morale of end users and dampen their daily productivity.
To avoid this, you can proactively provide sufficient training for your technicians, so they’re equipped to take on challenging tasks. Equip them with the right skills and the confidence they need to resolve any issue, so they can provide speedy and satisfactory resolution to end users.
To identify which technicians need training and when, it’s best to perform a skill-gap analysis. The below report offers a comprehensive view of technician efficiency against various categories of requests. Each technician is associated to a particular bubble color, and the size of the bubble indicates their expertise in that category.
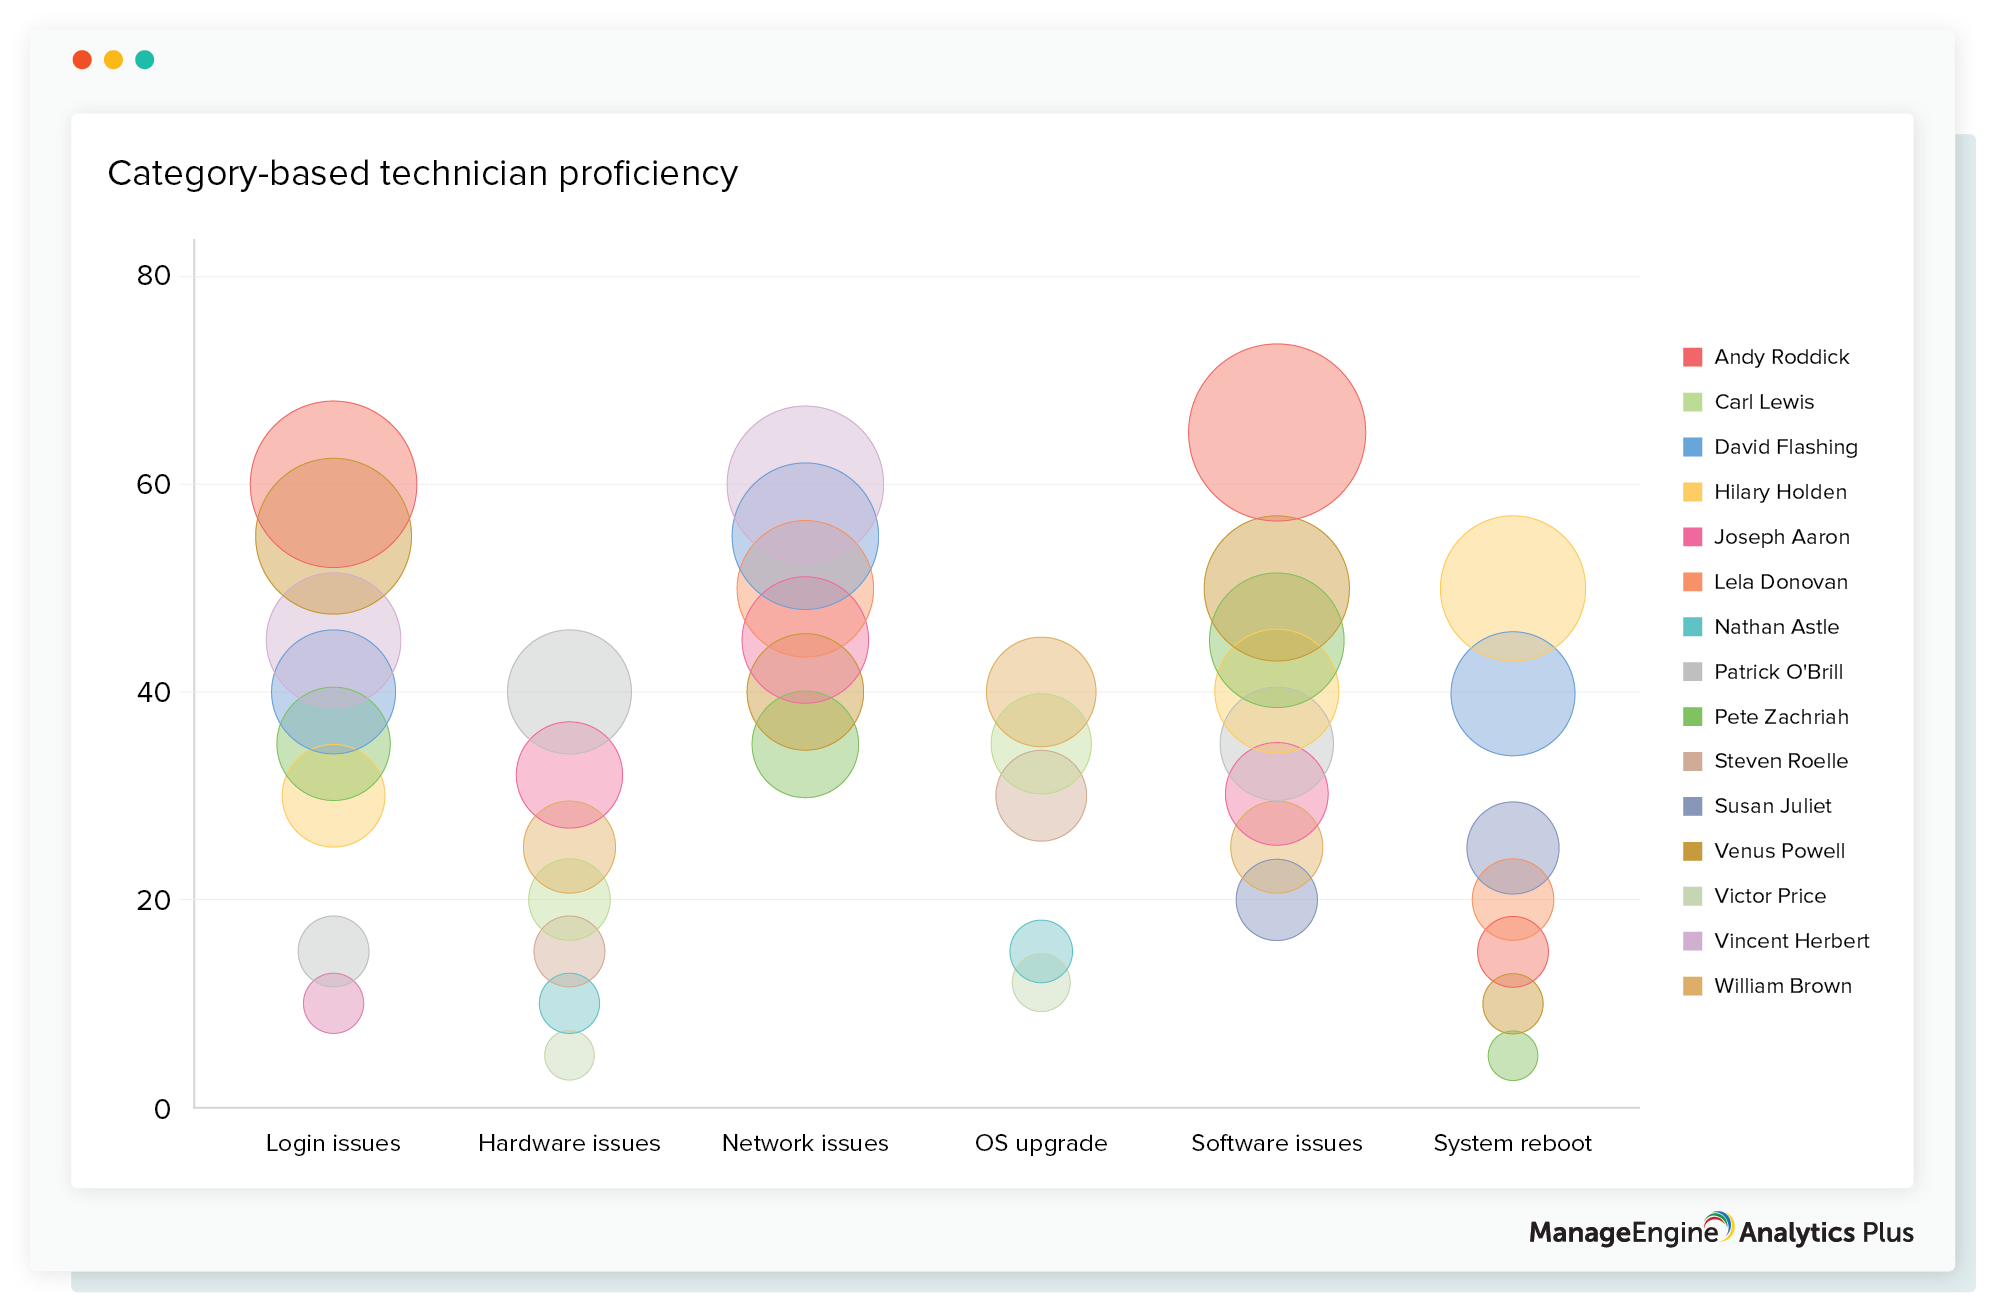
From the report, you can infer that, for most categories, there’s an even distribution of technicians to tackle requests of varying complexities. However for categories such as network issues and software issues, there’s a skill gap among technicians to handle low-level tasks. This calls for advanced training for technicians in network and software-related issues.
These reports were built using Analytics Plus, ManageEngine’s IT analytics solution, which offers out-of-the-box integrations with several popular IT applications such as ServiceNow, Jira Software, Zendesk, and ManageEngine’s umbrella of IT products such as ServiceDesk Plus, Desktop Central, OpManager, Applications Manager, and more.
If you’re looking for an IT analytics solution, start your free, 30-day trial of Analytics Plus now.
If you’re already an Analytics Plus user, please upgrade to the latest version to enable new features and updates.