Advanced analytics for ServiceDesk Plus' ticket history, projects, and knowledge base modules

We're happy to announce the release of advanced analytics for three more ServiceDesk Plus modules:
Request transition history—Visualize the complete request timeline, from ticket creation to ticket resolution.
Projects—Plan, manage, and monitor project progress to deliver IT projects on time.
Knowledge base management—Identify popular topics and create additional resources to promote a self-help culture.
Read on to see how this integration between ServiceDesk Plus and Analytics Plus gives enterprises better visibility into their help desk activity.
Understand the complete life cycle of help desk requests
Between the time a request is opened and the time it's resolved, it will likely get reassigned among technicians or technician groups. Until now, help desk managers had no way to figure out why or how many times requests got reassigned. With the introduction of advanced analytics for ServiceDesk Plus' request history, help desk managers can now track the complete journey of requests from start to finish, including information on how request reassignment impacts SLAs. Most importantly, managers can take steps to cut down on unnecessary reassignments.
For example, managers can see the average number of technician changes per request and correlate it with SLA compliance rates. Naturally, the higher the frequency of technician changes, the lower the SLA compliance rates will be since each transition involving a new technician increases the time taken to resolve the request.
Understanding the life cycle of requests can help pinpoint important yet often impossible-to-detect help desk problems, including:
Process-level bottlenecks
Lack of diverse skill set among technicians
Lack of technician expertise in solving specific IT issues
Using Analytics Plus' integration with ServiceDesk Plus' ticket history module, managers can also track the history of status changes and support group changes.
Track projects better with burn down charts
When handling multiple projects, it's easy to lose track of one or two. Burn down charts compare the actual work completed against the ideal work planned, giving managers clarity into the likelihood of their team completing the project on time. Armed with this information, managers can easily prioritize tasks, pump in more resources, alter deadlines, or if needed, assign additional accountability partners to ensure projects are completed on time. In addition to providing visibility into projects at a glance, burn down charts are useful for assessing how effective project plans are. For instance, repeatedly missing deadlines indicates too much work was committed to each milestone, while always completing work early indicates not committing enough man-hours to milestones. Similarly, managers can also track project inactivity if they spot a plateau in their burn down chart.
Keep knowledge base articles relevant
As self-service culture picks up pace, more and more users are now turning to knowledge base articles to resolve their IT issues. So, it's up to help desk managers to offer a self-service experience that users will love. However, self-service doesn't stop with simply stocking the knowledge repository with solutions and help documentation. Managers need to periodically review the quality of articles, and make sure they're relevant and offer true value to end users.
One way to judge the effectiveness of solutions and their relevance to the current crop of IT problems is to look at how many requests were resolved using knowledge base solutions. The higher the number, the more useful and effective the solutions are.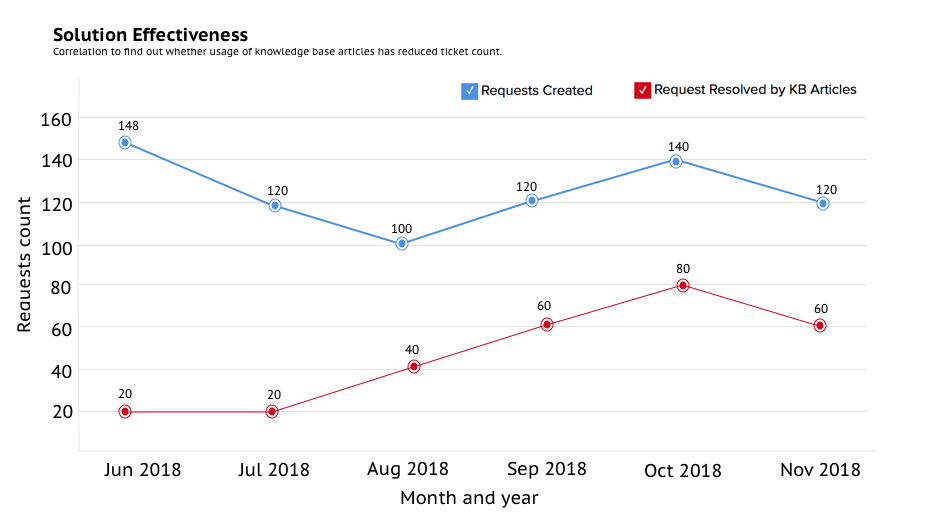
Keeping a knowledge base useful doesn't end with having a higher count of request resolutions using articles. Managers need to keep their knowledge base updated and look for solutions that are frequently used by end users, technicians, and support groups. Then, managers can take steps to create more solutions or articles under those popular topics.
The above modules are supported out-of-the-box as part of ServiceDesk Plus' integration with Analytics Plus.
If you're an Analytics Plus user, please upgrade to Analytics Plus build 3950 and ServiceDesk Plus build 9422 to explore these analytics. If you're new to Analytics Plus, start your free 30-day trial now.