Creating a Java monitoring strategy for high-availability systems
High-availability (HA) systems form the backbone of modern enterprise applications. In today's always-on world, Java applications are expected to deliver consistent performance with minimal downtime. However, achieving this critical objective is impossible without a well-defined and executed monitoring strategy. A robust Java monitoring approach is essential to ensure resilience, uptime, and peak performance.
In this blog, we'll explore how to design a comprehensive Java monitoring strategy specifically tailored for high-availability environments, and how to effectively implement it using powerful tools like Applications Manager by ManageEngine.
Why Java monitoring is crucial for HA systems
HA systems are engineered to provide continuous operation even in the face of failures, relying on redundancy, load balancing, and rapid recovery mechanisms. However, there's a fundamental truth: You cannot effectively manage what you cannot see.
Effective Java monitoring helps you to:
Detect issues early—often before users even notice them.
Minimize Mean Time To Resolve (MTTR)—speeding up the process of fixing problems.
Optimize performance under various load conditions.
Validate scaling and failover mechanisms, ensuring they work as intended.
Designing your Java monitoring strategy
Let's walk through the steps in building an effective Java monitoring strategy for HA systems.
Step 1: Define clear monitoring objectives
To monitor HA Java systems effectively, your strategy should aim to:
Track uptime and SLA adherence, ensuring you meet your service level agreements.
Detect performance degradation proactively.
Monitor failover effectiveness, confirming smooth transitions during disruptions.
Correlate logs, metrics, and traces to facilitate rapid root cause analysis.
Step 2: Finalize key metrics to track
A comprehensive monitoring strategy requires tracking a variety of metrics across different layers:
JVM-level metrics
Heap/non-heap memory usage
Garbage collection time and frequency
Active thread count
Class loading statistics
Application-level metrics
Request throughput (transactions per second)
Error rates and exceptions
Response time percentiles (P95, P99)
Database/query response times
Infrastructure metrics
CPU/memory utilization
Network latency
Disk I/O
Service dependency metrics
Health of downstream APIs
Message queue length
Database connection pool usage
Step 3: Identify tools to build your monitoring stack
While several open-source tools can form a robust monitoring stack, including Prometheus and Grafana for visualization, OpenTelemetry for distributed tracing, Micrometer and Spring Boot Actuator for custom metrics, and the ELK Stack for centralized logging, there is another powerful option worth highlighting.
Java monitoring with Applications Manager
Applications Manager by ManageEngine offers a comprehensive, out-of-the-box solution specifically designed for Java monitoring, making it an ideal choice for high-availability setups.
What makes Applications Manager effective for Java monitoring?
Automatic JVM discovery: It intelligently detects running Java processes and common application servers like Tomcat, JBoss, and WebLogic.
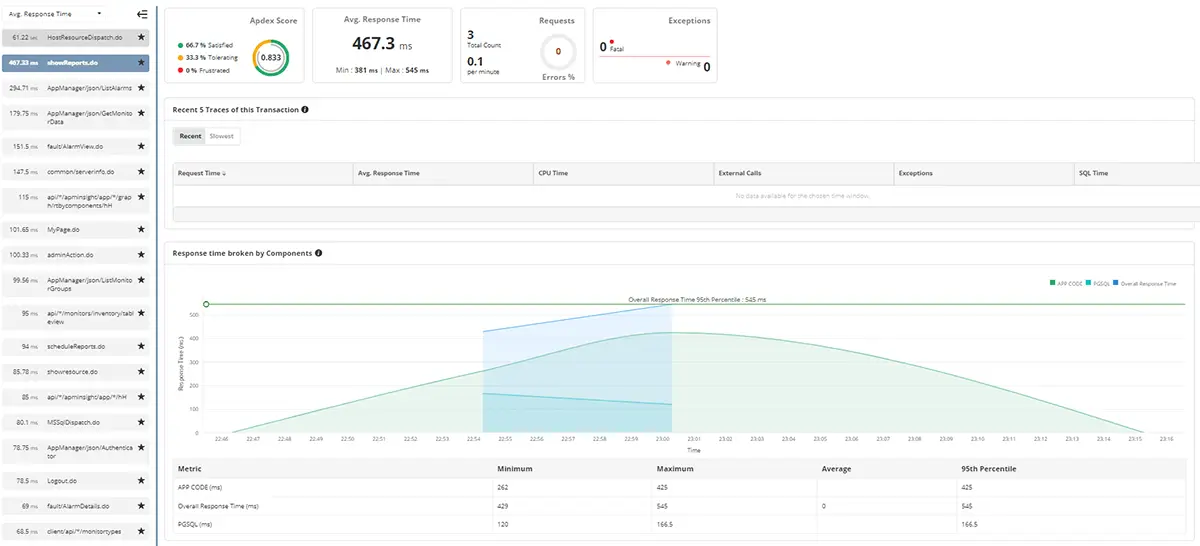
Deep JVM monitoring: Visualize critical metrics such as heap memory, garbage collection activity, thread status, and class loading in detail.
Custom business transaction tracking: Track your key business transactions and measure end-user response times with precision.
Integrated APM: Monitor performance seamlessly across the application, server, and infrastructure layers.
Intelligent alerts & thresholds: Set dynamic thresholds and receive proactive notifications before minor issues escalate.
HA-friendly dashboards: Gain a centralized view of all nodes within a clustered Java environment, simplifying oversight.

Use case: Monitoring a Java microservices application
Consider a Java-based microservices application deployed across multiple nodes behind a load balancer. With Applications Manager, you can:
Monitor each JVM across all nodes from a single, unified dashboard.
Track service availability and transaction latency across your distributed system.
Set up sophisticated multi-condition alerts (eg: heap usage exceeding 80% and response time exceeding three seconds).
Generate comprehensive availability and SLA reports for compliance and performance review.
As a bonus, Applications Manager can even monitor containerized Java applications running in Kubernetes, providing visibility into your modern deployment environments.
Step 4: Set smart alerts, not just alarms
Effective alerting in HA systems requires a refined approach:
Noise-resistant: Prevent alert fatigue by filtering out irrelevant noise.
Context-aware: Ensure alerts include relevant logs or traces for immediate context.
Actionable: Alerts should clearly point to specific components or potential causes, guiding rapid resolution.
Applications Manager excels in this area with its smart alert grouping capabilities and options for automated remediation.
Step 5: Continuously improve through feedback loops
A monitoring strategy is not static; it requires continuous improvement:
Perform regular failover drills and closely observe how your monitoring stack behaves.
Use monitoring data in post-mortems to identify and address any visibility gaps.
Track trends to forecast resource needs accurately and plan future capacity upgrades.
HA systems inherently demand high-visibility solutions, and robust Java monitoring serves as your primary defense against performance issues and outages. While open-source tools offer flexibility, Applications Manager stands out for its ease of use, deep JVM insights, and enterprise readiness. This makes it an excellent choice for teams managing complex Java ecosystems and striving for maximum uptime and performance.
Experience the full power of Applications Manager. Start your 30-day, free trial today!