9 Kubernetes monitoring best practices: A practical guide to successful implementation
1. Embrace full-stack observability

- Metrics: Performance indicators like CPU usage, memory consumption, network throughput, and pod availability.
- Logs: Detailed records of application and system events, aiding in debugging and forensic analysis.
- Traces: End-to-end visibility of requests flowing through microservices to detect bottlenecks and latencies.
2. Focus on the correct Kubernetes metrics
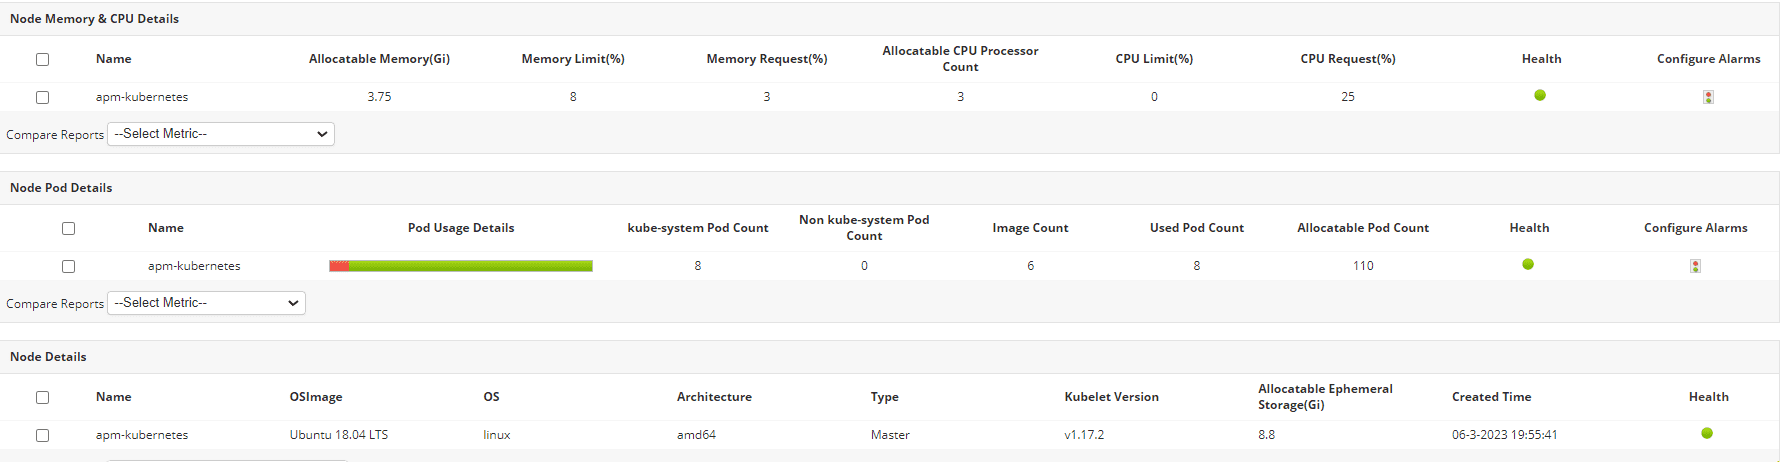
- Cluster health: Understanding the overall health of your cluster is paramount. Track node health, resource availability, and scheduler performance to ensure the stability of your Kubernetes environment.
- Pod and container performance: Monitoring the performance of individual pods and containers allows you to pinpoint resource bottlenecks and identify performance issues within specific applications.
- Application performance: Focus on application-level metrics that directly impact user experience, such as request latency, error rates, and database performance. These metrics provide the most direct insights into the quality of service your users are receiving.
Metric Category | Specific Metric (Example) | Importance |
Cluster level | kube_node_status_condition | Identifies unhealthy nodes impacting overall cluster stability. |
node_cpu_usage_seconds_total | Tracks overall CPU resource consumption and potential bottlenecks. | |
node_memory_Active_bytes | Monitors memory pressure and potential resource shortages. | |
scheduler_e2e_scheduling_duration_seconds | Indicates scheduler performance and potential scheduling delays. | |
kube_deployment_status_replicas_available | Tracks the health and availability of deployed applications. | |
Pod and container performance | kube_pod_status_phase | Indicates the health and status of individual pods. |
container_cpu_usage_seconds_total | Identifies CPU-intensive containers and potential resource contention. | |
container_memory_usage_bytes | Monitors memory consumption by individual containers and potential memory leaks. | |
container_network_transmit_bytes_total | Tracks network bandwidth usage by individual containers. | |
kube_pod_container_restarts_total | Indicates potential instability or crashes within a pod. | |
Application performance | http_server_requests_seconds | Measures application responsiveness and user experience. |
http_server_requests_total{status="5xx"} | Identifies application errors and potential issues. | |
http_server_requests_total | Tracks application traffic and request volume. | |
database_query_time_seconds | Identifies slow database queries impacting application performance. | |
database_cache_hit_ratio | Monitors database caching efficiency and potential performance bottlenecks. | |
Custom application metrics | Provides insights into application logic and specific functionalities. |
3. Implement labeling and tagging for efficient monitoring
- Environment: Use the env label (for example, env=production, env=staging) to easily distinguish and manage workloads across different environments. This is essential for isolating production traffic from development or testing activities.
- Microservice: Use the service label (for example, service=payment, service=auth) to identify and group related microservices. This simplifies monitoring and troubleshooting, enabling you to focus on specific components of your application.
- Version: Use the version label (for example, version=v1.2.3, version=v1.2.4) to track deployments and facilitate rollbacks. This is critical for managing application updates and ensuring the ability to revert to previous versions if necessary.
4. Configure smart alerting to prevent fatigue
Alert types
- Critical: Alert on events requiring immediate action (for example, service downtime, high pod eviction rate, node failures).
- Warning: Alert on potential issues that may require attention (for example, increased latency, CPU/memory nearing limits).
- Informational: Track important events for informational purposes (for example, successful deployments, auto-scaling events).
Advanced techniques
- Thresholds: Set up thresholds for all the aforementioned priorities.
- Anomaly detection: Leverage AI-driven platforms like Moogsoft to detect unusual behavior.
- Alert deduplication and correlation: Reduce false positives by deduplicating and correlating alerts.
5. Monitor multi-cluster and hybrid cloud deployments

6. Optimize monitoring for high-cardinality data

- Reduce unnecessary metric collection by filtering high-cardinality labels.
- Use downsampling and retention policies in Prometheus to optimize storage.
- Apply adaptive sampling in distributed tracing to capture only essential data.
7. Strengthen security in Kubernetes monitoring

- Role-based access control (RBAC): Implement RBAC to control access to monitoring dashboards and ensure that only authorized users can view and modify monitoring configurations.
- Data protection (Encryption): Encrypt logs and metrics both in transit and at rest to protect sensitive operational data from unauthorized access.
- Activity monitoring (Auditing): Regularly audit API requests and cluster events to detect suspicious activity and identify potential security breaches. These audit logs can also be invaluable for forensic analysis in the event of an incident.
8. Automate and scale your monitoring setup
- Employing GitOps for configuration management.
- Scripting for log rotation, metric collection, and alert tuning.
- Scaling monitoring components (for example, Prometheus, Grafana) based on demand (for example, using HPA).
- Leveraging ManageEngine Applications Manager’s auto-discovery to dynamically track new Kubernetes resources.
9. Conduct continuous testing and optimization
- Proactively identify and address performance issues: Regular load testing and chaos engineering help you uncover potential problems before they impact users.
- Reduce downtime and improve application reliability: By identifying blind spots in your monitoring coverage, you can improve your incident response processes and minimize downtime.
- Optimize resource utilization: By gaining deeper insights into application behavior, you can optimize resource allocation and reduce costs.
- Maintain compliance: Regularly reviewing and updating your monitoring configurations helps you ensure that your monitoring system continues to meet regulatory requirements.
About ManageEngine Applications Manager