Monitoring NGINX with Applications Manager

NGINX is open-source software that started out as a web server and now provides various solutions such as web serving, reverse proxying, caching, load balancing, media streaming, and more. It also serves as a proxy server for email (IMAP, POP3, and SMTP) and a reverse proxy and load balancer for HTTP, TCP, and UDP servers.
If your organization uses an NGINX server to tackle scaling challenges, understanding and analyzing performance issues of NGINX can go a long way in avoiding sudden outages. Ensuring optimal performance of the servers can help improve resource utilization, maximize throughput, and reduce latency. ManageEngine Applications Manager's out-of-the-box support for monitoring NGINX gives you comprehensive insights that empower you to quickly identify and fix performance issues.
Let's take a quick look at how you can monitor NGINX servers with Applications Manager.
Setting up an NGINX monitor
With Applications Manager, setting up your NGINX server for monitoring is easy. All you need to do is fill out fields like Display Name, Hostname, Server Status URL, and Polling Interval, and enable/disable certain options according to your requirement. Refer to our documentation for detailed instructions on creating an NGINX monitor.

Visualizing key performance metrics of NGINX servers
With Applications Manager's NGINX server monitoring capabilities, you can visualize NGINX performance metrics related to the health, availability, and performance of your NGINX and servers. This helps you identify issues in your web infrastructure and resolve them to help improve the end-user experience.
Monitor response time and active connections
Once you enable monitoring for your NGINX server, you can track key metrics such as response time and active connections. The NGINX monitoring dashboard in Applications Manager displays a graph of Response Time over time. This information can give you insights about how fast the server responds to a request that it receives. If this value spikes and violates a set threshold, it may be time to analyze what's causing the server to respond slowly.

The Active Connections count refers to connections that are active currently. This information helps you to understand the load being handled by the NGINX server.

Keep track of requests
NGINX servers typically receive a lot of requests. A request can be defined as an event at the application level. NGINX servers handle multiple requests at the same time. This enables the servers to process multiple requests simultaneously. These requests can be in various states from the time that it is accepted to the time that it is handled.
Requests can be in various states, including:
Reading: The state in which the NGINX server is reading an accepted connection from the client.
Writing: The state in which the NGINX server is writing a response for an accepted connection from the client.
Waiting: The state in which a connection is idle and is waiting to be handled.
It is essential to monitor the number of requests along with the number of requests in each of those states to understand the efficiency of the server.
With Applications Manager's NGINX monitoring tool, you can effectively keep tabs on Requests/sec, Requests in Reading state, Requests in Writing state, and Requests in Waiting state.
With information about Requests/sec, you can get insights about the level of interaction with the end users.

You can also quickly discover problems such as slow performance if you see an unusual spike in the number of requests in the waiting state. You can also analyze the efficiency of the server by comparing the values of requests being handled versus the requests in the idle state. Applications Manager also supports NGINX Plus monitoring.

Leveraging the power of NGINX with ManageEngine Applications Manager
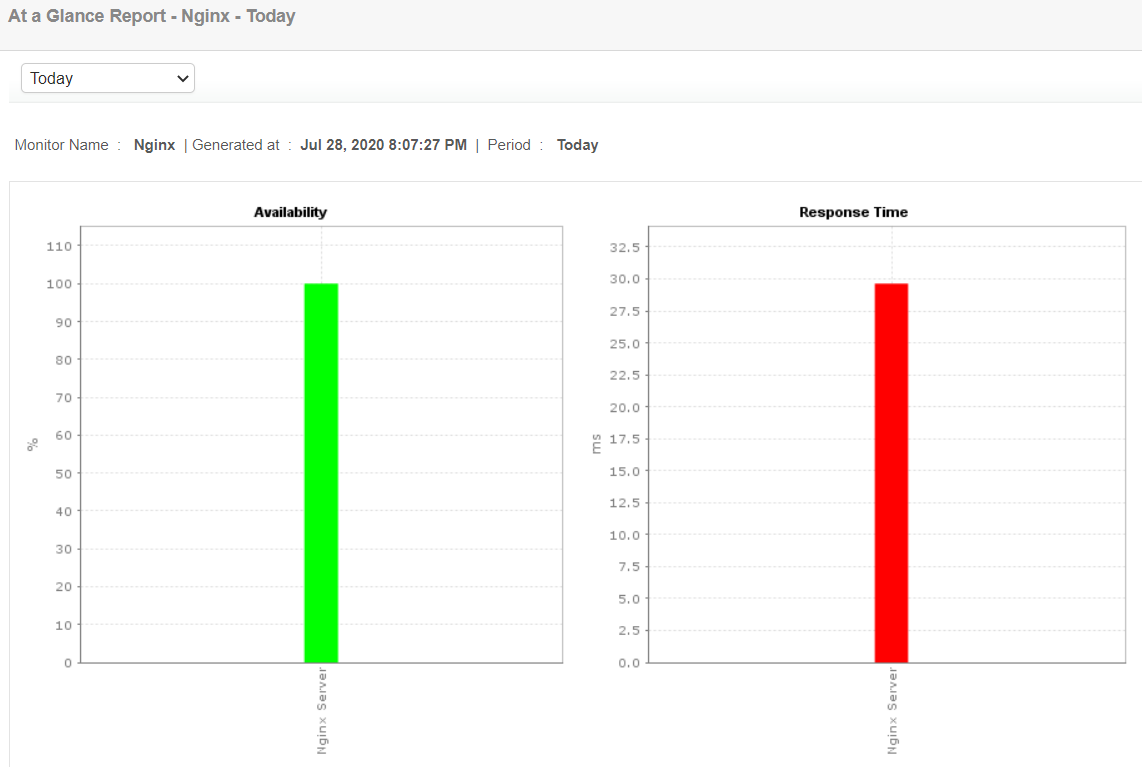
When you add an NGINX monitor in Applications Manager, you get an overview of how well your NGINX server is performing.
Applications Manager's NGINX monitoring system also detects anomalies, identifies application faults, discovers the root cause of issues, and enables you to fix them before they affect your web infrastructure and end users. The NGINX performance monitor also produces extensive reports on your server's well-being, accessibility, and performance.
It also tracks other key performance metrics explicit to the resource being tracked. Applications Manager also has AI-empowered analytics that help you to visualize current resource utilization and generate predictive future trends. This can make your decision-making process a hassle-free experience.

Start monitoring NGINX servers within minutes
If you're already an Applications Manager user, you can start monitoring NGINX servers from your installed version. Alternatively, you can start a free, 30-day trial today, and begin monitoring NGINX along with the rest of your applications, infrastructure, and services—all from a single platform.