PostgreSQL offers flexibility on how data is stored and compared in a relational database. This is why it’s so popular among enterprises as a solution for their database requirements. Although PostgreSQL is quite reliable, database problems are inevitable, especially in large-scale environments. Ignoring these problems could result in a plunge in the productivity of your business.
However, if a PostgreSQL monitoring tool is employed, it can help database administrators proactively identify issues before they overwhelm the database. Applications Manager offers dynamic PostgreSQL monitoring, which helps enterprises get the best performance out of their PostgreSQL database by tracking key performance metrics in real time.
It also helps database admins (DBAs) stay up to date on the health of their database servers, so that they can know about availability issues and avoid server downtime, saving a substantial amount of time and resources.
Let’s take a look at the key performance metrics you need to monitor in a PostgreSQL database.
Response time
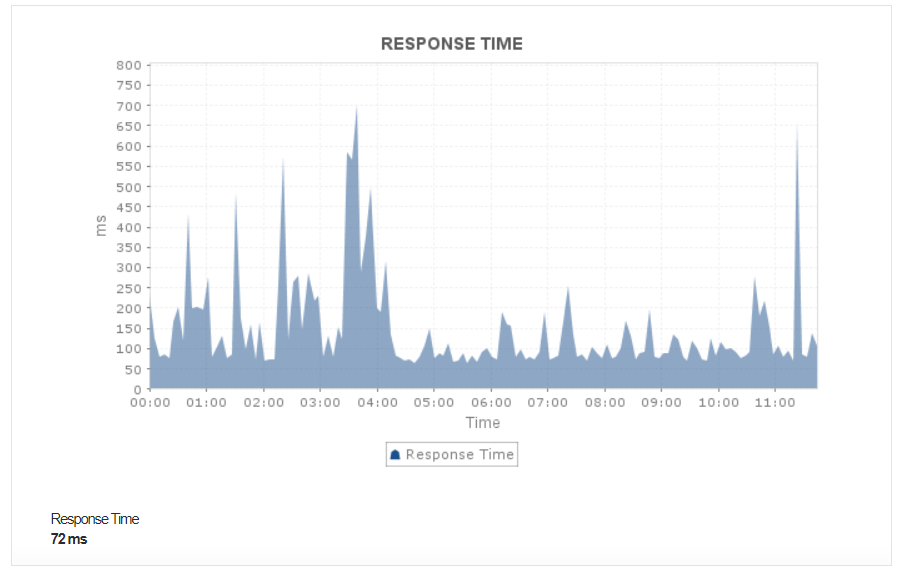
Response time is an important indicator of a database server’s overall performance and efficiency. It is the time taken by the server to respond to a certain command/query from the time it was issued.
High response times can be a warning about your server performance declining. Applications Manager’s PostgreSQL monitor constantly tracks the response time of your database server and alerts you instantly if something is askew. You can analyze the server, and check for long-running queries to optimize server performance.
Connection statistics
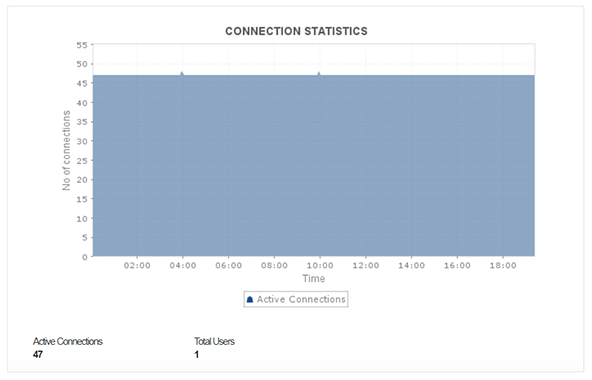
A PostgreSQL database server performs various activities based on rules defined by a database administrator to aid in important business operations in an organization. The server can have multiple active connections running concurrently in the database.
Applications Manager’s PostgreSQL performance monitoring tool helps detect slow performance by monitoring the number of active connections. If the number of connections is high, you may need to analyze the state of these user sessions, and terminate idle sessions that are slowing down the server.
Lock statistics
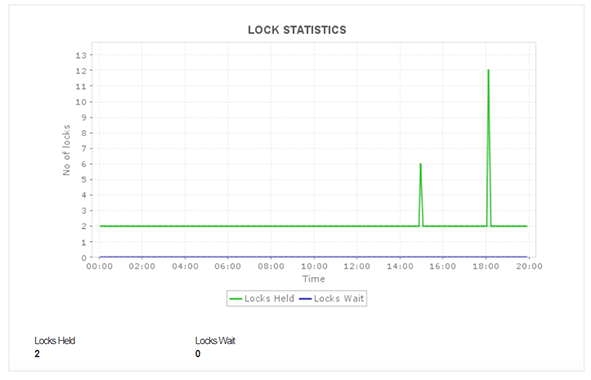
Database requests involve performing complex transactions that retrieve, change or modify data. PostgreSQL provides various lock modes to control concurrent access to data in tables. This mechanism ensures consistency of data in the database.
Applications Manager monitors the locks held and locks wait values, which offers insight on data locks and helps with discovering performance degradation occurring through lock contention.
Buffer statistics
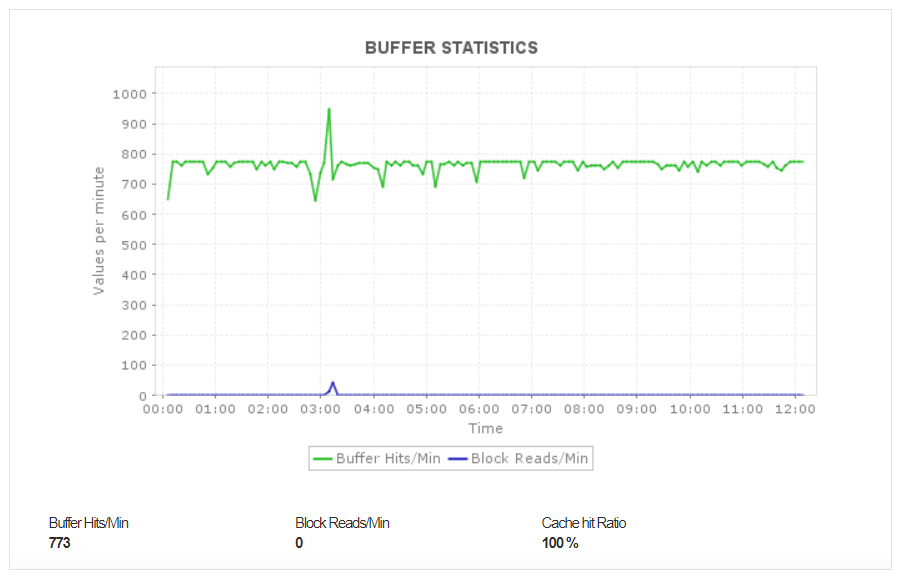
Database operations are usually faster when data is read from the memory. PostgreSQL offers different types of buffers such as shared buffers, WAL buffers, and CLOG buffers. These buffers have varied capabilities and functions. For example, shared buffers store data for quick access, WAL buffers store metadata about changes to actual data for database recovery operations, and CLOG buffers hold commit log pages.
Applications Manager monitors buffer statistics and alerts you when the value of the Cache Hit Ratio decreases. A low Cache Hit Ratio value indicates that an increasing amount of data retrieval for your requests is happening from the disk. So, you might need to analyze the health of your cache and its underlying configurations to optimize and improve your server’s performance.
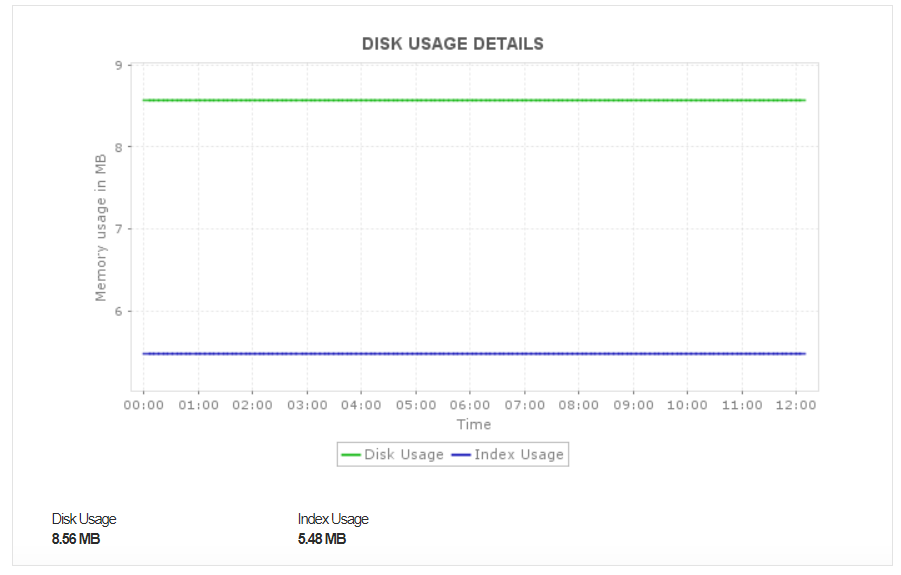
Disk and index usage details
Disk usage is an important metric, as it can indicate the overall efficiency of a database server. It helps you better plan and manage the storage and capacity of your PostgreSQL database.
PostgreSQL supports the usage of indexes. An index is a special lookup table that efficiently optimizes the retrieval of a small number rows from a table. Although an index helps to accelerate the SELECT queries and WHERE clauses, it slows down data input with UPDATE and INSERT statements, thereby making it a pivotal PostgreSQL performance metric.
Applications Manager tracks disk and index usage of your PostgreSQL database server. An increase in disk space implies data retrieval is increasingly happening from the disk, which indicates a bad cache configuration and will ultimately lead to increased latency. If you find an increase in the index usage, you may have to clear up the unused indexes.
Transaction details
A database server essentially carries out various transactions that are pivotal to business processes. A transaction is a unit of work performed by a user or a database program that executes one or more changes in the database. It is important to control transactions to ensure data integrity and handle database errors. PostgreSQL uses commits and rollbacks to control transactions.
Applications Manager tracks the transactions occurring in the database and monitors the commits and rollbacks that occur every minute. If too many transactions are taking place, you may want to utilize backup servers to ensure availability. If crucial transactions are occurring, you can redirect the read operations to a backup server and execute write/commit operations in the primary server to distribute and administer the load.
![]()
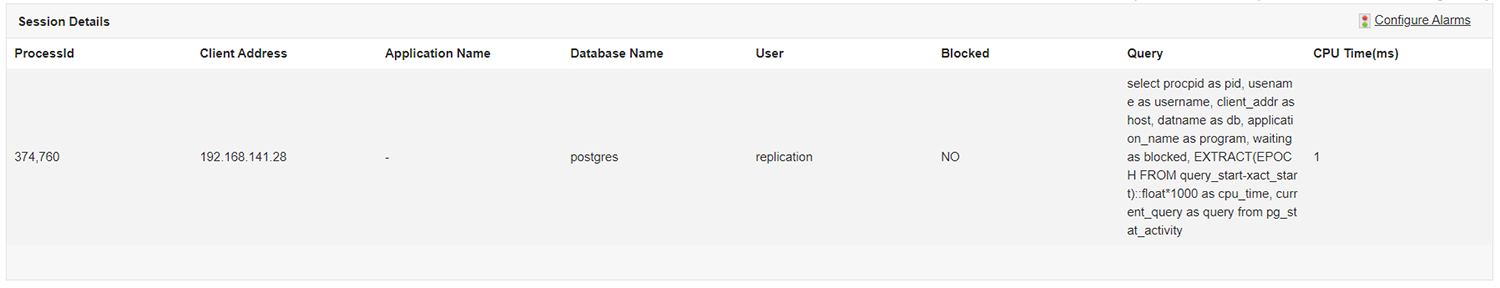
Session and query details
An important aspect of business operations in database servers is executing queries that perform, read, write, update, or delete operations. These queries can be executed in various sessions in a PostgreSQL server. Monitoring the sessions and queries can give you an understanding of what operations are being executed in the database.
Applications Manager allows you to monitor PostgreSQL sessions. With this information, you can know about blocked sessions. It also displays the top 10 queries by CPU utilization and shows a list of long-running queries, using which you can identify and isolate queries that are slowing down the database.
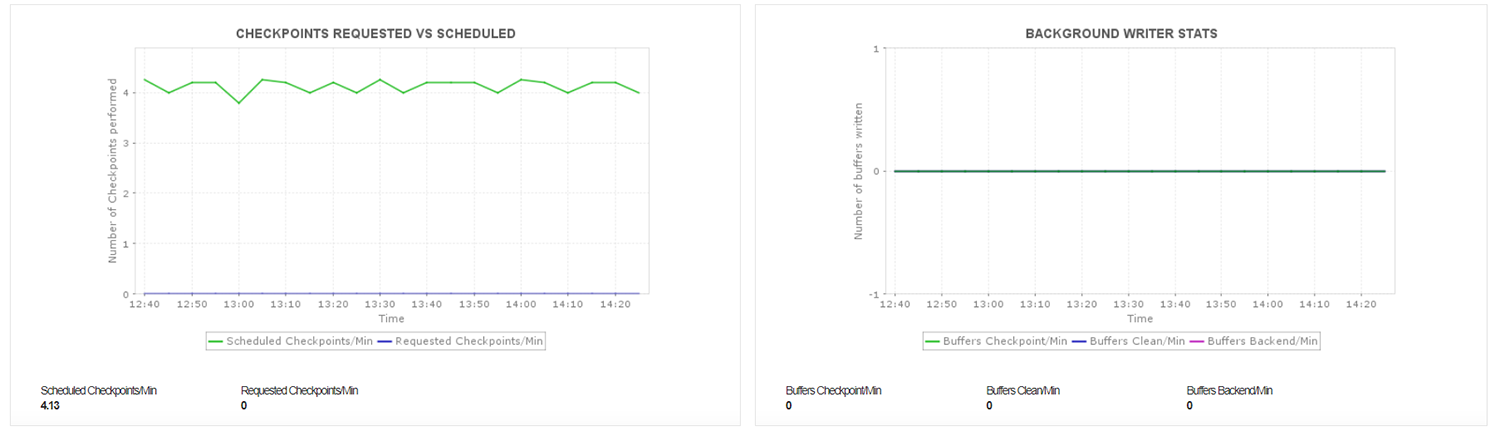
Replication details
Replication is a process wherein data is copied (synced) from a database on one server (master) to a database on another server (slaves). PostgreSQL offers an internal streaming replication service that creates a high-availability environment, balances the load of read-only queries across several nodes, creates a read-only database to run analytical queries on, and many other pivotal functions. Monitoring replicas is a pivotal aspect of PostgreSQL monitoring as replicas can sometimes go out of sync.
Applications Manager enables you to detect out-of-sync replicas by gathering information about replication delays. It also lets you track the number of scheduled checkpoints and requested checkpoints to ensure low I/O loads.
Start monitoring in minutes
Applications Manager is an effective tool for monitoring not only the PostgreSQL database server, but also a wide range of other databases (RDBMS, NoSQL, in-memory), applications, and infrastructure elements. You can download a free, 30-day trial of Applications Manager, and set up Postgres monitoring in just minutes.