Continuing with our how-to series of posts, today’s article discusses the steps involved in configuring a WebSphere server in Applications Manager.
Step 1:
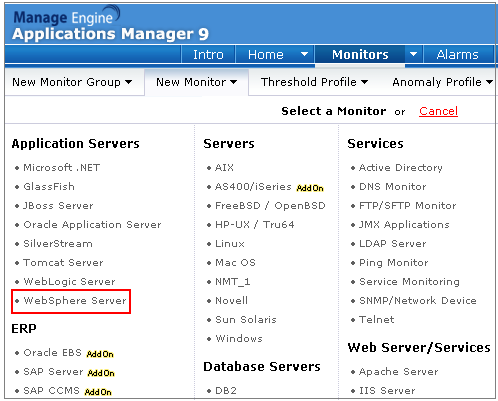
Click New Monitor drop-down menu and select WebSphere Server link under Application Servers category.
Step 2:
In the ‘Add Monitor’ screen that opens up, specify the following details:
- Deployment mode of the WebSphere server. You can choose either Base or Network Deployment.
If you select Base Mode, enter the Host Name/IP Address of the host in which the WebSphere application server is running.
If you select Network Deployment, enter the Host name/IP Address of the WebSphere Application server in which the perf servlet is installed. This will automatically discover all the WebSphere servers in Network Deployment. - SubNetMask of the WebSphere server. If you have multiple system IP addresses configured with a single DNS name, select the ‘Do not resolve DNS name’ option under ‘Advanced’ section.
- Port number. The default value is 9080.
- Polling Interval in minutes
- WebSphere version – choose from 5.x, 6.x, 7.x and above.
- SOAP Connector Port (8880 by default)
- If you want to monitor WebSphere through SSL mode, select the ‘SSL is enabled’ checkbox.
- Enter username and password for authentication if Global Security is enabled.
- If you have chosen the ‘Network Deployment’ mode, specify the Network Deployer Host and Network Deployer SOAP Port values. The default SOAP port is 8879.
- If you want to monitor selected app servers running in the WebSphere server, select the ‘Advanced Options’ checkbox and specify the app servers in the ‘App Servers to Monitor’ field. If you want to monitor all the app servers in the WebSphere server, leave this field empty.
- The Monitor Group with which you want to associate this monitor (optional).
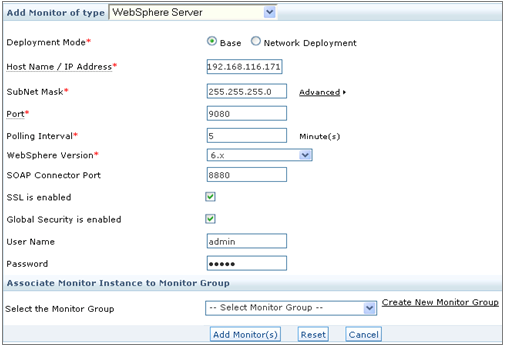
Once you’ve entered the necessary information, click the Add Monitor(s) button. This action triggers discovery of WebSphere server from the network and adds it for monitoring.
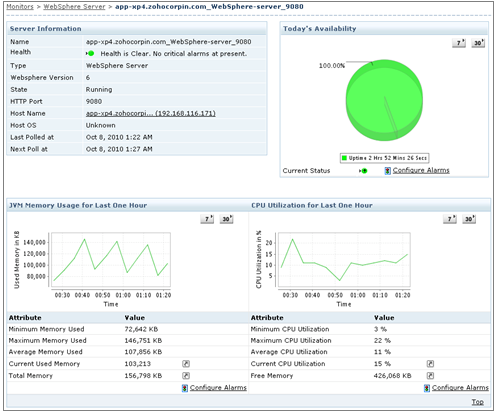
You can then navigate to the WebSphere monitor details page and view performance metrics collected by Applications Manager.
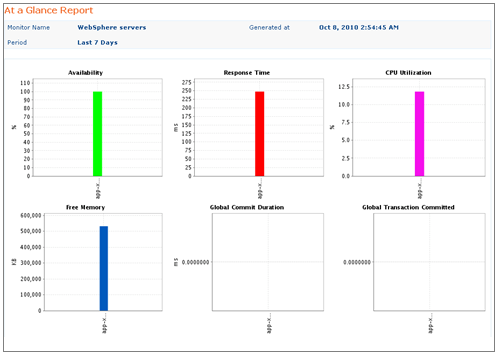
The Reports section contains useful performance reports of WebSphere servers. For example, the ‘At a Glance’ report shows metrics such as CPU utilization, response time, availability, free memory, etc. all in a single report.
Hi Maria,
Apologies, we missed this comment.
Can you let me know which version of WebSphere server you are monitoring and your Applications Manager build number?
Hello… I am facing an issue that Manage Engine is showing websphere server unavailable for 5 mins, however, my server was running and services were also being provided to the users through that server during that duration. What can be the possible reasons for the unavailability? What all things are required to be rechecked in this regard?