How to add a WebLogic Monitor in Applications Manager
The how-to series of blog posts are back and this time we will look into the process of configuring a WebLogic monitor in Applications Manager. As is the case with configuring other monitor types, you can add a WebLogic server for monitoring in two simple steps.
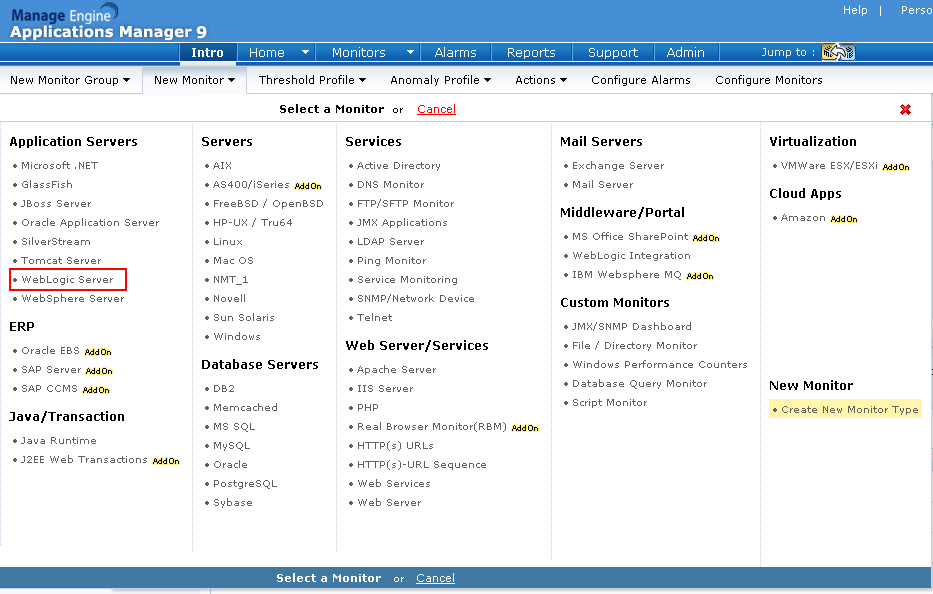
Step 1:
Click New Monitor drop-down menu and select WebLogic Server link under Application Servers category.
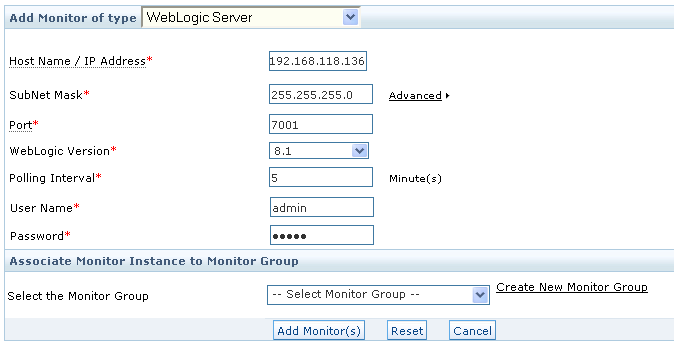
Step 2:
The 'Add Monitor' screen opens up. In this screen, specify the following details:
Once you’ve entered the necessary information, click the Add Monitor(s) button. This action triggers discovery of the WebLogic server from the network and adds it for monitoring.
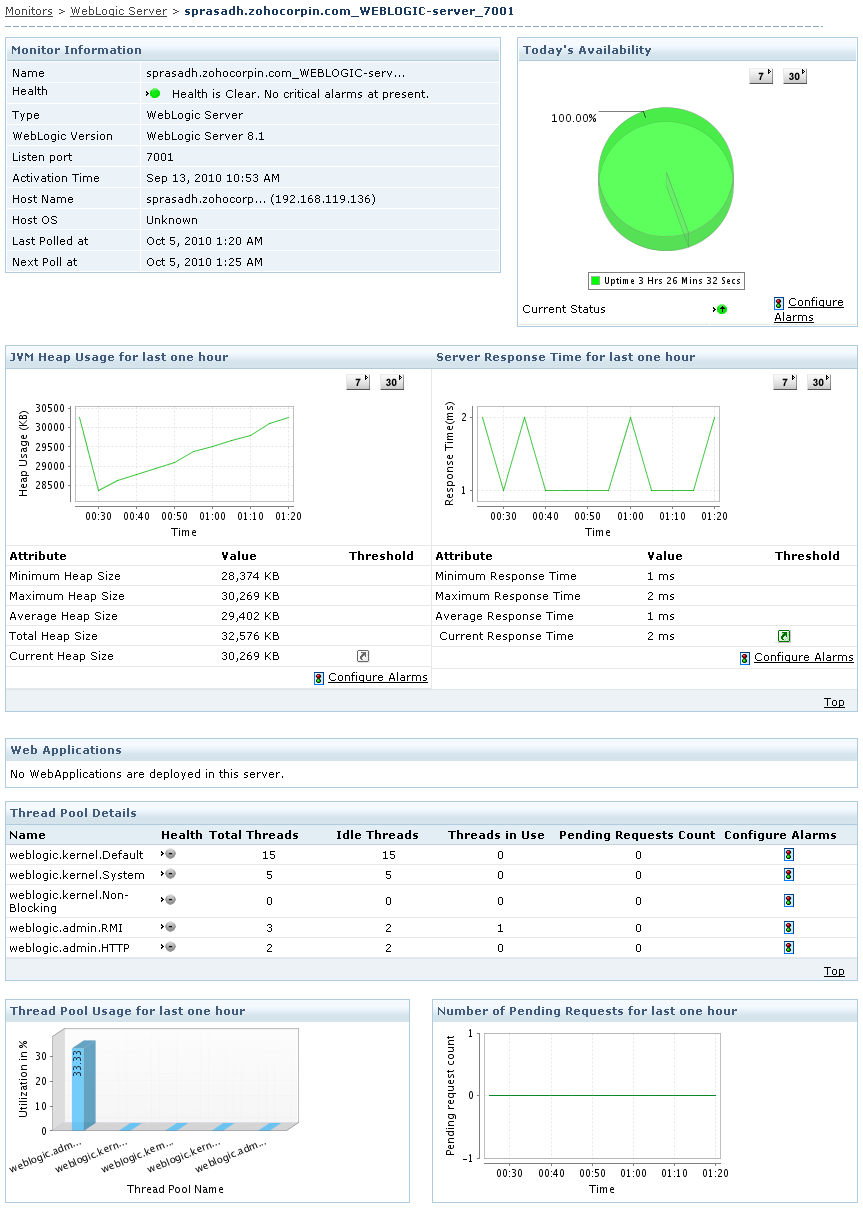
You can view performance metrics of the server you've added from the WebLogic monitor details page.
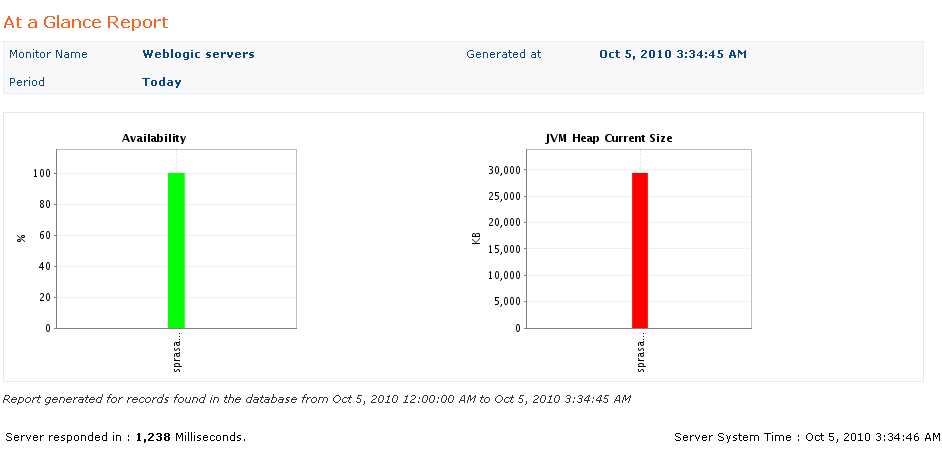
You can also understand about the performance of your WebLogic server through our reports section. Here is a sample ‘At a glance’ report for WebLogic servers.
Related Posts:
How to add an AS400 monitor in Applications Manager
How to add a SAP monitor in Applications Manager
Step 1:
Click New Monitor drop-down menu and select WebLogic Server link under Application Servers category.
Step 2:
The 'Add Monitor' screen opens up. In this screen, specify the following details:
- Host Name / IP Address of the WebLogic server.
- Subnet Mask of the server. If you have multiple system IP addresses configured with a single DNS name, select the ‘Do not resolve DNS name’ option under ‘Advanced’ section.
- Port number where the WebLogic server is running.
- The Version of the WebLogic server you are monitoring.
- Polling Interval in minutes
- Username and Password for authentication.
- The Monitor Group with which you want to associate this monitor (optional)
Once you’ve entered the necessary information, click the Add Monitor(s) button. This action triggers discovery of the WebLogic server from the network and adds it for monitoring.
You can view performance metrics of the server you've added from the WebLogic monitor details page.
You can also understand about the performance of your WebLogic server through our reports section. Here is a sample ‘At a glance’ report for WebLogic servers.
Related Posts:
How to add an AS400 monitor in Applications Manager
How to add a SAP monitor in Applications Manager