Ever since the work from home (WFH) and study from home (SFH) initiatives became widespread due to the outbreak of COVID-19, there has been a huge effort among organizations to either set up new broadband connections or upgrade existing connections with higher bandwidth speeds.
No matter the number of command centers an internet service provider (ISP) might have, keeping up with users’ demands—whether it’s about network speed or volume—can be a colossal undertaking. Sure, there are a number of open-source network traffic monitors that have all the basic functions, but they also demand a certain amount of time and expertise for entering all those lines of code.
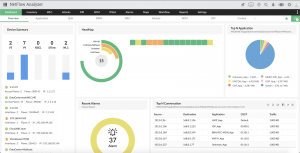
Why spend all those hours on a tool that provides the bare minimum when you could be using that time for improving the user experience? Read on to learn how ManageEngine NetFlow Analyzer can save you time, provide all the functions you need, and more.
Device visibility and grouping
Every ISP needs a traffic monitoring tool that provides visibility over various connections to see if connections are up or not. NetFlow Analyzer takes this a step further to provide real-time traffic stats based on utilization, speed, packets, and volume of any number of connections as long as they are configured in NetFlow Analyzer.
Drill down options are available in each tab in graphs and tables to give you a more meticulous view on various factors affecting the network performance, like current network speeds, top conversations, idle devices, and more.
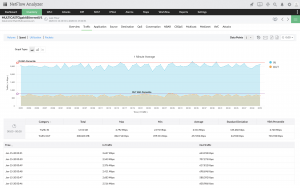
If you need a way to view various interfaces collectively, the built-in grouping option has your back. The interface grouping feature allows you to group two or more interfaces, and helps you monitor, generate reports on, and create bills for each group cumulatively.
Threshold-based alerting
The first step in saving time is organizing your interfaces with limits and rules. This makes it easy to notify your customers whenever they have crossed the allocated bandwidth, or if their network speed drops below the promised broadband speeds.
NetFlow Analyzer generates an alert whenever traffic utilization exceeds a predetermined threshold profile. Effectively leverage thresholds by creating, editing, and deleting your alert profiles as needed.
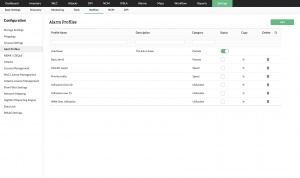
Alert profiles use these three factors to generate alerts:
-
Utilization: the bandwidth limit each interface or interface group is expected to consume.
-
Duration: the time period through which the alert profile is to monitor and generate alerts based on threshold violations.
-
Frequency: the number of times utilization is allowed to exceed the threshold before an alert is raised.
Billing reports
An ISP’s bandwidth managing tool would be incomplete without a distinct option for billing. With NetFlow Analyzer, you can create a billing plan based on speed or volume, and let the tool do the rest.

It really is as simple as that. Once you fill in the required details like Bill Plan, Bill Type, Base Volume (or Speed), Base Cost, Billing Period, and Bill Generation Date, you’re all set.
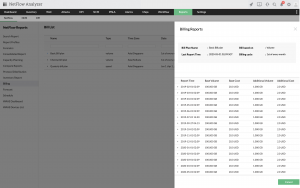
NetFlow Analyzer will now take care of generating the bill as per the configured details and will also export the reports to the customers’ email addresses and locally on the hard drive as needed. In addition, you can also create bills for interface groups, which is a convenient feature if a customer has purchased more than one connection at various locations.
Capacity planning
Now that the required alerts are set, you can focus your attention on your network’s infrastructure. Capacity planning in NetFlow Analyzer helps you estimate the bandwidth demand, recent network trends, and much more, which helps you plan and improve your network’s current setup.
You can filter these reports by business hours to exclude the weekends, or vice versa, giving you more precise statistics on bandwidth usage. Now you can focus on exposing vulnerabilities in your bandwidth management plans, and invest time in improving the internet experience of your customers.
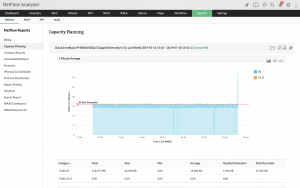
You can export all these stats in PDF or CSV format and can even email stats to the desired email addresses. The Generate Bill button also provides you with a bill for that particular interface or group.
Scheduling and comparing reports
With NetFlow Analyzer, pulling daily, weekly, or monthly network usage reports for customers is easy. Since the tool’s report generation and delivery system is automated, all you have to do is create a schedule, sit back, and watch the magic happen.

Scheduled reports will generate consolidated reports by default, but reports can be customized as well if that’s what you prefer. You can create any number of schedules you want, keep reports dormant by disabling their schedules, and activate them when required.
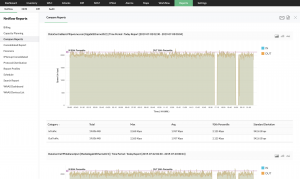
If your customer asks for a comparison on their network’s usage, NetFlow Analyzer has you covered. With the tool’s built-in report comparison module, you can choose to either compare the same device over different time periods, or compare different devices over the same time period to generate comparison reports for every day, hour, week, and month.
Mobile app
With working from home currently a major priority, you can use your smartphone to carry out work tasks. With mobile apps for both Android and iOS, you gain complete control over your entire network anywhere, anytime with just a few taps and swipes. The instant push notifications and preconfigured alerts on various concerns like network device availability and performance can help you monitor, diagnose, and address issues quickly all without the help of your laptop.
NetFlow Analyzer is a part of ManageEngine’s ITOM suite of solutions. Apart from bandwidth monitoring, ITOM also has solutions to streamline network monitoring, server monitoring, application monitoring, configuration management, firewall security and compliance, IP address management, and switch port management. Truly, this makes ITOM solutions an ideal choice for over one million IT admins, worldwide.

