
If you own an enterprise, then you know the value of a healthy network and how seriously detrimental a network outage is to your business. But network issues are inevitable. The heavy dependence on networks to meet the ever-changing client and internal usage requirements takes a heavy toll on the network.
This makes networks vulnerable to common problems such as unplanned, sudden downtime, high resource utilization, and hardware malfunctioning.
So, facing bottlenecks is not new to a network, but the key lies in how well you mitigate the frequency of issues.
Two focus areas to reduce network issues
- Mean time to repair (MTTR): It is a measure of the average time taken to repair a fault and restore the network back to normalcy. A high MTTR value can hurt you financially and force you to pay penalties for SLA non-compliance. So, having an effective, robust network fault management system is crucial.
- Finding the root cause: Networks are complicated systems consisting of a wide variety of devices and interfaces, and this makes it a huge challenge for network administrators to locate the root cause of network bottlenecks precisely. Time elapsed in locating network issues means that your network's MTTR is constantly on the rise, and this may affect your business eventually.
The way forward: Root cause analysis in monitoring
Problem identification is the biggest challenge that one faces while trying to mitigate MTTR. Maintaining a low MTTR will retain the trust customers have in your business, and protect your business from falling apart.
With the objective of enabling you to deeply analyze network performance, we have introduced the
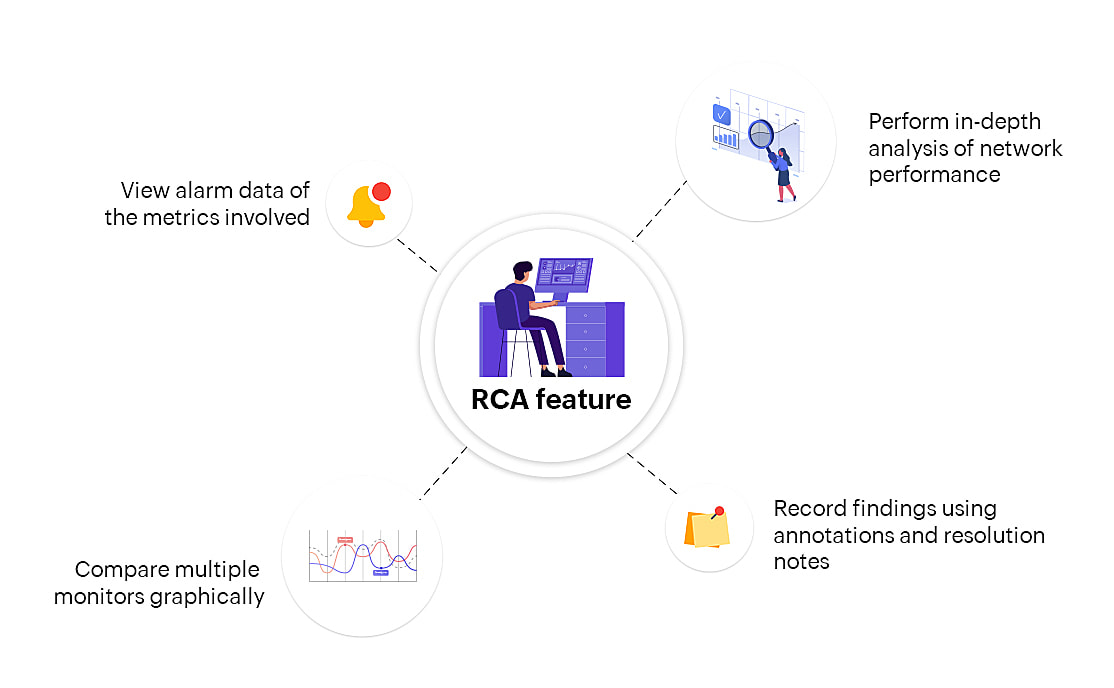
Root Cause Analysis (RCA) feature in OpManager.
Using RCA, you can gain comprehensive visibility into the network monitoring data of all your devices, interfaces, and URLs in a centralized console.
With complete visibility into the relevant monitoring information, the time taken to analyze performance and narrow down the root cause is significantly reduced, resulting in a lower overall MTTR value.
Important features
Compare monitors graphicallySimply drag and drop the performance metrics of your selected devices, interfaces, or URLs and RCA automatically builds a chart with performance curves, each representing a monitor.
Compare multiple devices’ performance on a single metric, or multiple metrics for a single device, all in one view.
 Record your interpretations
Finding the root cause is about gathering necessary monitoring data, comparing and analyzing it deeply, and finally recording your interpretations. Using the annotation option, you can record your findings and add resolve notes once you find the root cause. When you want to halt your analysis midway, you can record your interpretations up to that point and save them.
When you return, you can continue from the point where you left off. This also immensely helps when multiple team members collaborate in finding the root cause. For example, a network admin can perform RCA and record their findings, and later, a senior-level manager can read the annotation notes and make data-driven decisions on configuration changes in the network.
 Perform RCA for groups
This option is useful to
analyze the performance of a set of devices or interfaces collectively. For example, when a particular network in a specific site goes down, you can select the network (group), which automatically populates the devices specific to that group, and you can begin analyzing the performance issues straight away.
How does RCA simplify network monitoring?
Without RCA, identifying the root cause is a pain in the neck. For example, imagine an alarm is raised when a core router in your network goes down. You need to drill down into the alarm data and also visit the snapshot page of the device to understand more about the issue.
This method may seem easy when you need to perform root cause analysis for only one device. But what if multiple devices in your network go down and this results in a complete network failure?
With RCA, you can view performance graphs of various monitors in a centralized module and compare all of them in a single pane. With a comprehensive set of information on your screen, analyzing performance and locating the root cause of an issue becomes a walk in the park.
RCA saves the day: A real-world use case
Let's say users report a sluggish load speed while accessing your app. To resolve the issue completely, you have to pinpoint the real cause and then take corrective measures.
First, you can track the CPU and the memory utilization of your application server to understand whether the slow load speed is due to a server overload. Ruling out this possibility will allow you to analyze the next set of possible causes.
A slow loading speed may also arise when your app server is waiting on the storage device that houses your file system. You can check the IOPS, latency, throughput, and utilization of your storage device to understand if the issue is because of an underperforming and overutilized storage device.
Sometimes, the slow load speed may also arise due to bandwidth issues in the interfaces connecting the server and your storage environment. Monitoring the Interface Rx and Interface Tx metrics will help you locate bottlenecks, if any.
So, when you encounter a complex scenario such as the one discussed above, you will need to compare the performance of multiple network components. RCA provides the platform to assemble all the data in a single view, analyze it, rule out possibilities, and narrow down the exact root cause of issues in less time.
Learn more about OpManager, and download a
free, 30-day trial version. You can also experience a free online demo, or schedule a
free, personalized demo with our experts who can answer all your product questions.
Nice one! I reckon this RCA features might be an USP for ManageEngine ITOM solution