OpManager doubles the number of device templates, cuts your work in half
Just last month we heard flattering statements about OpManager's UX, and nothing makes us happier than knowing that our continuous improvements have positively impacted our users. We're always eager to meet your growing IT infrastructure needs, so we're happy to introduce a set of 4,000 new device templates. That doubles the number of OpManager device templates to over 8,000, helping you in your goal of comprehensive network management. You can monitor your routers, switches, RAID storage, domain controllers, firewalls, UCSs, and printers so much easier now.
What are device templates in OpManager?
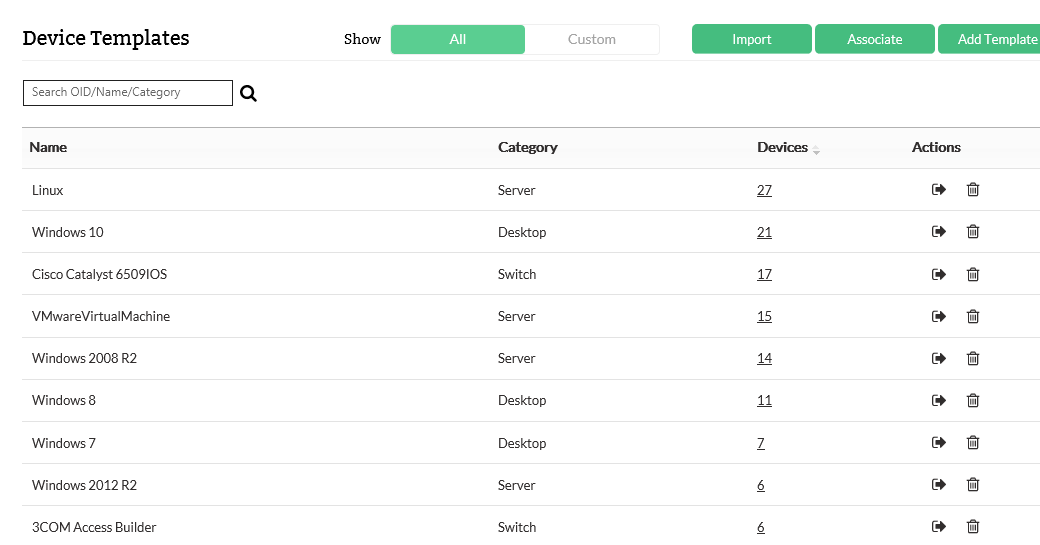
OpManager classifies devices based on their architecture and associates a set of predefined device and vendor type configurations, called device templates, with the classified devices. Device templates enable you to implement and apply a configuration change to several devices at once. OpManager can classify network devices as servers, printers, switches, routers, and firewalls, and it supports most device vendors including Cisco, Juniper, Meraki, 3Com, Fortinet, HP, D-Link, and Palo Alto Networks.

Why do I need built-in device templates?
OpManager offers an encyclopedic list of predefined device templates to make monitoring easy. You can add any component in your network to OpManager and it will be identified, listed, categorized, and constantly monitored. You can list device types, add device properties, and maintain an inventory of every single component in your network. You could also modify thresholds, monitoring parameters, and intervals for devices in bulk using device templates.OpManager also lets you create custom device templates, but the built-in templates cut down the time and effort you'd normally spend fine-tuning them.
How can I improve my organization's efficiency with OpManager's device templates?
Let's use an example: Say you started an e-commerce website two years ago. You use OpManager to ensure your Cisco MCS 7825I server is always up and running. You set up server threshold monitoring to alert you when CPU utilization reaches 75 percent and set the monitoring interval for two minutes. You also add a process count monitor to know how many processes are running on your server.
Suddenly, business is booming. You're happy about the growth, but you realize it could be a nightmare because you'll need more IT infrastructure to support your business; not to mention, you need granular-level network performance monitoring.
Since the boom in growth, you now have a total of seven Cisco MCS 7825I servers to monitor. CPU utilization has grown to always be above 80 percent, but that doesn't really affect traffic. So you simply change the threshold level to 85 percent. You change the monitoring interval to one minute as you have more orders to dispatch. You also add a new monitor to keep server temperature in check. You disable the process count monitor to have fewer metrics to look at. Finally, you associate all servers with the changed threshold configuration. All this can be easily accomplished when you have each device in your network discovered and associated with a template. Your work is reduced to just choosing monitors for the devices you want to keep a tab on. The best part is, device templates allow you to automatically make all these modifications on all servers at once. This is how you breathe easy as you run your business smoothly with OpManager's device templates.
OpManager also lets you receive threshold violation alerts through SMS, email, push notifications, or web alarm, whichever you prefer. So what are you waiting for? Let OpManager do all the heavy lifting when it comes to your network infrastructure. Try OpManager for free.

