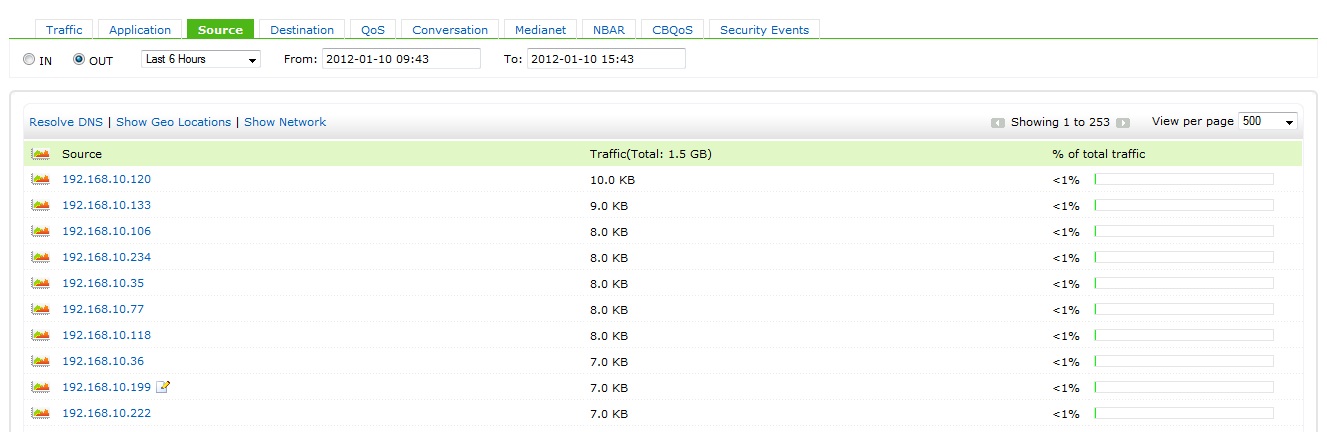
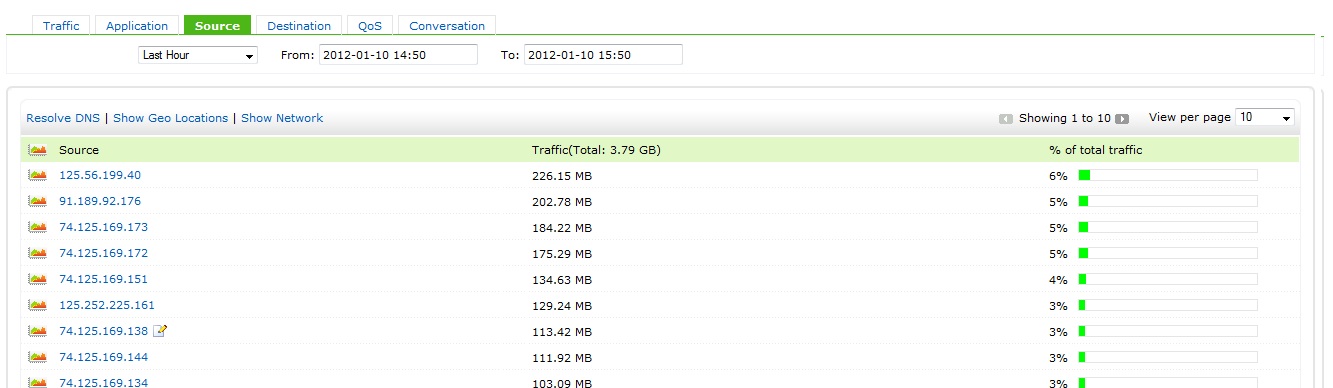
Source/Destination tab helps find the traffic from an individual host passing through a specific interface. The Source table will group all the source IP address in the conversation and the total traffic contributed by that host will be displayed. You can further drill down to an IP address/host to view the destination host with the application used and the amount of traffic transferred. This would be the same for Destination tab also.
Many customers have doubts regarding the IP that is shown as the top contributor under the conversations tab is not the top contributor in the Source/Destination tab. This is because, the conversations tab lists every conversation happened whereas the Source/Destination tab will group those conversations based on Source/Destination IP address. When grouping is done, the top IP in the conversation might have less traffic compared with the other IP address. So, combining the conversations results in traffic difference in this tab.
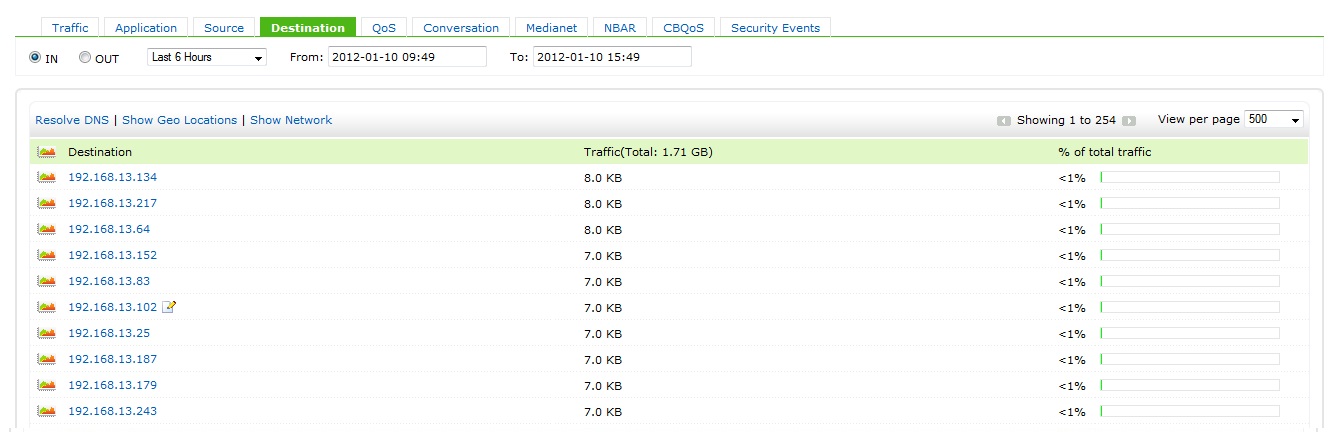
This tab accounts for the IN and OUT traffic of an interface separately. For example let’s assume there is traffic coming IN from the Internet to your LAN and you are monitoring your WAN Interface, the Source IN will be the public network IP Address and the Destination IN will be your LAN IP.
If traffic is from your LAN to the internet through WAN interface the Source OUT will be your LAN IP and the Destination OUT will be the internet IP.
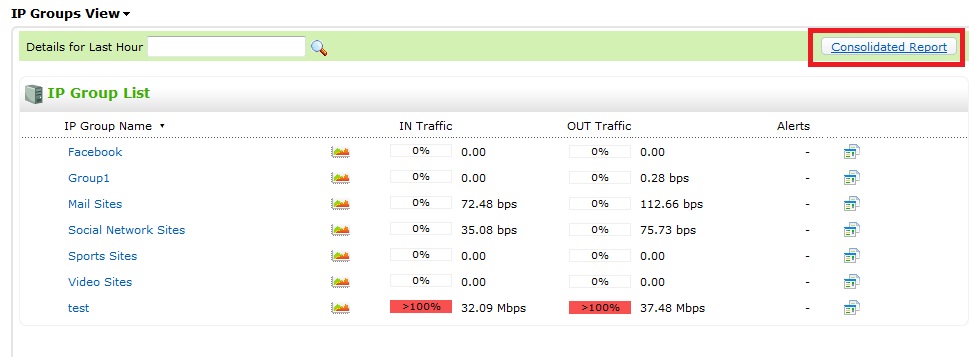
Source/Destination Tab in IP Groups:
The function of these tabs will be the same but there will be no IN or OUT. This is because the accounting of traffic is different from the Interfaces. In a conversation if the destination IP address matches with the credentials for that IP Group, this conversation will be accounted as IN traffic for that IP groups. Similarly, if the Source IP matches it will be accounted as OUT traffic.
Therefore in the Source tab will be accounting the Source IP address from which the destination is contacted and the Destination tab will show the IP addresses to which the groups was trying to communicate.

Hope this helps.
You could also visit us at booth #E81/E84 ICC London ExCeL at Cisco Live, London between January 30 – February 3, 2012.
Join us on twitter @NetFlow-geek
Reach us on Facebook at NetFlow Analyzer TAC
Catch up with the latest updates in the industry, through our LinkedIn community Bandwidth Monitoring and Traffic Analysis for Enterprises
Arun Karthik Asokan
NetFlow Analyzer Technical Team
Download | Interactive Demo | Twitter | Customers