Comparing the traffic utilization of IP Groups in a single report
This blog is to let you know how NetFlow Analyzer can be efficiently used for generating report for comparing the traffic stats for different data-centers or departments in your network.
Imagine the time and the hassles involved in collecting the data form those groups from all you devices.Then consolidating the data you have and generating the report. Furthermore that accuracy in the report that is been generated will be less.
When you use NetFlow Analyzer you can save time, improve the accuracy in the data shown with less hassle.
You can achieve them by follow the steps mentioned below:
Create IP Groups
Generating report
Creating IP Group:
For creating an IP groups follow the steps mentioned below:
Click on IP Group ? Add in NetFlow Analyzer UI.
Create IP Groups for each data-centers or the subnets separately.
Click here to know more about IP groups
Once the IP groups are created, it will automatically starts collecting the information.
Generating Reports
One Click Consolidate Report:
This report displays the traffic Helps you to get the traffic stats of all IP Groups in a single screen. To procure this navigate to Devices ? IP Groups view in NetFlow Analyzer UI and click on Consolidate report on top right corner of the UI.


The generated report is as below:

This report will help you to generate reports with the graph and showing you the Min , Max and the average utilization of the IP Groups you select. To procure this navigate to Devices ? More Report(s) ? compare Report NetFlow Analyzer UI. Select IP groups and you can pick the groups you wanted to generate the report.


The generated report is as below:
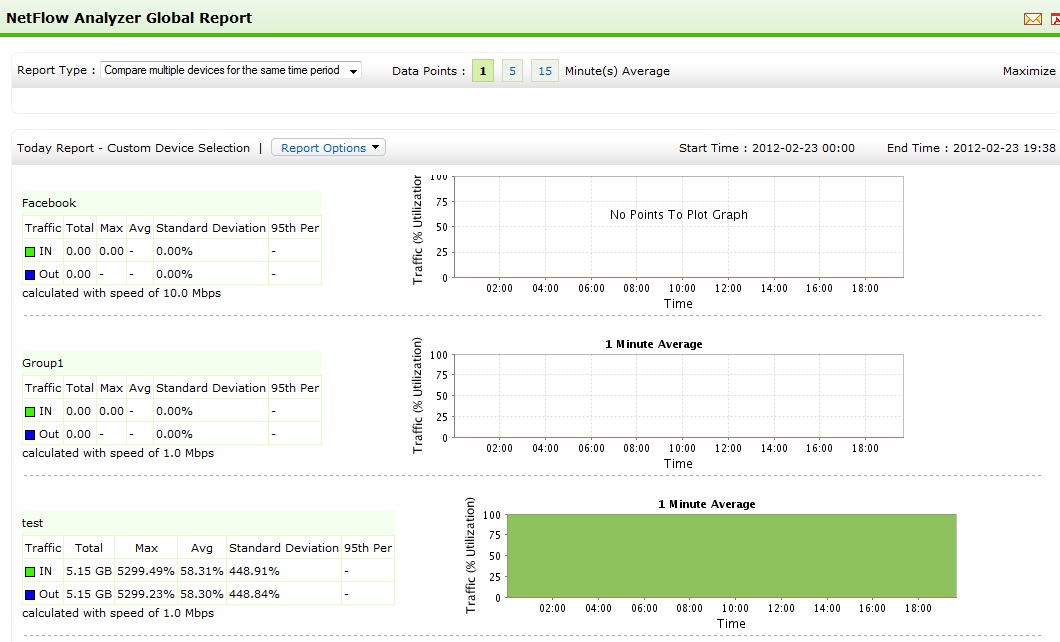
Once the report is generated you can export it to PDF or CSV, cane be sent via email and even this can be scheduled.
Hope this helps.
Arun Karthik Asokan
NetFlow Analyzer Technical TeamDownload | Interactive Demo | Twitter | Customers