Redis, which stands for Remote Dictionary Server, is an open source, in-memory data structure store that’s used as a database, memory cache, and message broker. It stores data entirely in memory in the form of key-value pairs. This gives it an edge over all other databases, as it eliminates the need to access data from the disk. It also makes Redis one of the fastest NoSQL databases, where data is accessed in microseconds because there are no seek time delays. Several well-known companies such as Twitter, GitHub, and Snapchat use Redis.
Although Redis databases are characterized by high availability and data persistence, it is still important to keep track of their performance. The performance of your application is directly impacted by that of the database that powers it. Therefore, getting a holistic view of the database’s entire stack is essential to ensure you keep on delivering value to your customers. IT operations teams need a Redis monitoring solution like Applications Manager to ensure their Redis deployments are healthy and meet the requirements of their performance-sensitive applications.
Let’s take a look at the key Redis performance metrics you need to monitor to maintain and manage your Redis database efficiently.
CPU usage
A database server’s overall performance and efficiency is usually determined by its CPU usage. Applications Manager provides detailed graphs on the CPU usage of your Redis database, including the percent of CPU consumed by system processes and user processes. Tracking the percent of system CPU used helps you ensure the host on which Redis is deployed has good processing power at all times. Applications Manager also displays children CPU usage through time, which can help you analyze which background processes (like SORT, SUNION, BGSAVE, and BGREWRITEAOF) are using excessive CPU.
If you find the CPU usage of your Redis database increasing over time, you may need to keep an eye on the volume of queries, especially slow ones. Optimizing these slow running queries can help improve Redis performance.

Memory utilization
Memory utilization is an important factor of Redis performance. If high memory utilization is left unnoticed, it may lead to serious performance degradation.
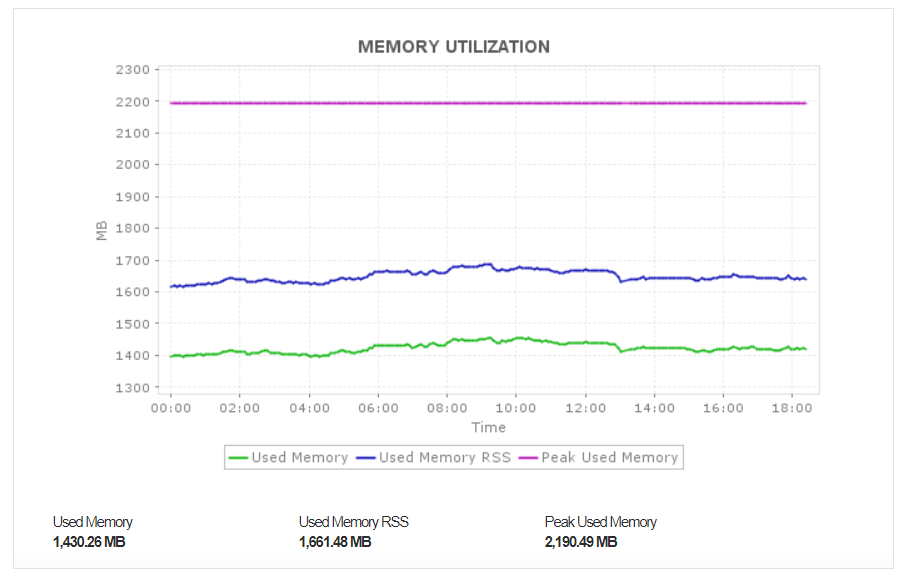
Applications Manager’s Redis performance monitor tracks three components of memory utilization:
-
Used Memory: This represents the total number of bytes allocated by Redis using its allocator (a function that helps manage memory occupancy). Monitoring this metric can help prevent “Out of memory” errors in the database.
-
Used Memory RSS: This is memory resident set size, or the number of bytes that the operating system has allocated to Redis. This information helps identify memory fragmentation.
-
Peak Used Memory: This is the peak memory consumed by Redis (in bytes).

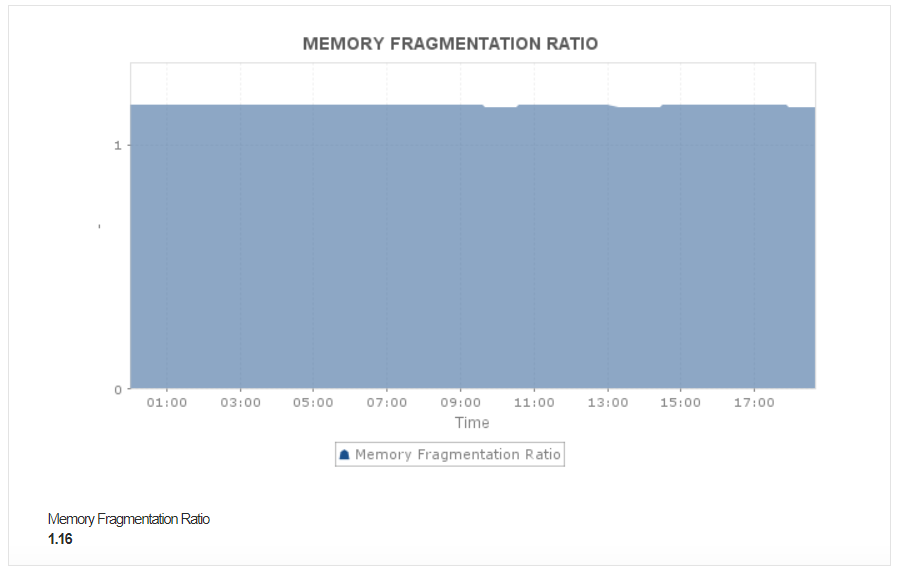
Applications Manager also keeps track of the memory fragmentation ratio—the ratio of used memory RSS to used memory. If the memory fragmentation ratio exceeds 1.5, it signifies excessive memory fragmentation. Usually fragmented memory can be regained by restarting the Redis server. A fragmentation ratio below 1 indicates that Redis needs more memory than is available on your system, which results in swapping. Swapping to disk will cause a significant increase in latency.

Client and connection statistics
Redis enables access to data by accepting clients. These clients are authorized through the TCP port. It is important to keep track of the number of clients, as it is an indicator of the load on the database.
Applications Manager monitors the count of connected and blocked clients, as well as the total number of connections and rejected connections. An increased number of blocked clients can point to the fact that the database is employing blocking commands due to some long pending threads or processes that are waiting to receive data from the network. Monitoring active connections helps you ensure that you have adequate connections to handle all requests at peak times. If there is an increase in the number of rejected connections, it may indicate that the Redis database has reached the limit on the maximum number of clients that can be connected concurrently and you may need to disconnect idle clients.

Operation statistics
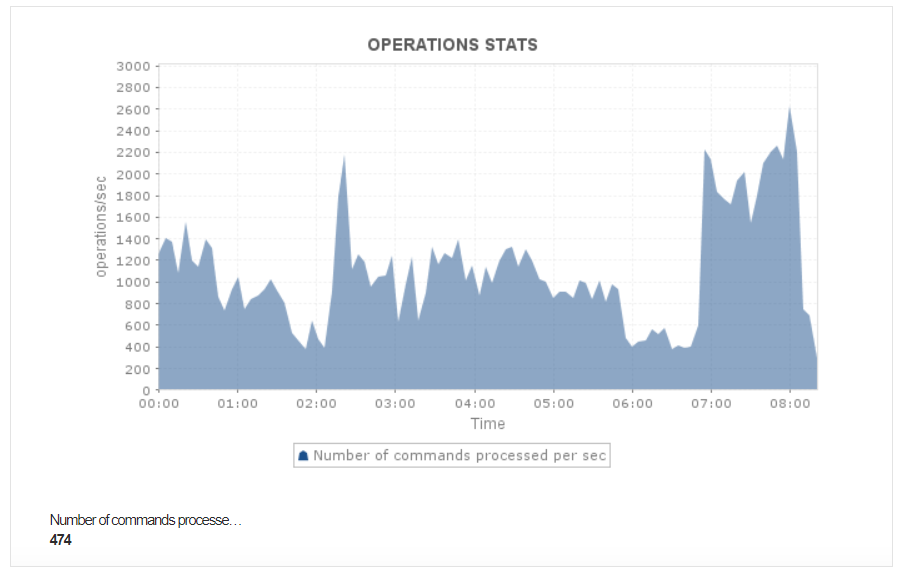
A Redis database, like any other database, has several commands that are executed in order to handle various database requests. Applications Manager’s Redis monitor tracks the number of commands processed per second. This is a critical Redis performance metric because it helps you detect causes of high latency. With this information, you can identify and remove backlogged command queues and slow commands which will in turn reduce the latency in the database.

Keyspace statistics
A keyspace in Redis refers to an internal dictionary that stores all the keys in the database. When Redis works as a cache, clients retrieve data from keyspaces. A keyspace hit indicates the key was found, while a keyspace miss indicates that it was not. In this context, the cache hit ratio is the ratio of keyspace hits to the sum of keyspace hits and keyspace misses. Applications Manager’s Redis monitor tool keeps track of the number and percentage of successful and failed lookups of keys in the main dictionary. This information can help you take the necessary steps to increase the cache hit ratio by analyzing missing keys and removing dead ones, ultimately reducing latency.

Expired/evicted key stats
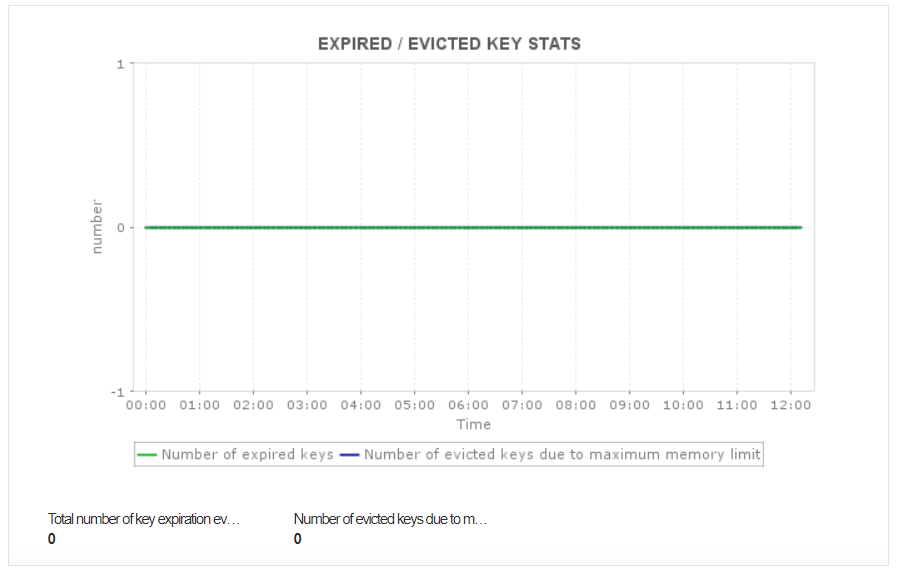
The keys in Redis databases have a property called time to live (TLL) associated with them. The Redis database deletes a key if the TTL has elapsed. It is up to the application to set each object’s TTL value. If the application does not define this property, it causes expired data to pile up in Redis’ memory. Applications Manager helps you keep track of expired keys and keys that are frequently being accessed by commands, reducing the possibility of encountering keyspace misses.
Redis supports several configurable eviction policies that are used by the server to free up memory when memory usage hits the upper limit. You can use Applications Manager to track the number of evicted keys. Too many evicted keys indicates an increase in latency, as new requests need to wait for an empty space before being stored in memory.

Applications Manager also provides information about the number of keys present in each database, including the number of expired ones.

Persistence stats
In a database, persistence of data is a crucial characteristic. Redis databases employ replication processes for backup reasons, so it’s even more important to monitor persistence statistics in Redis.
Applications Manager displays details about the persistence states of Redis database files (RDBs) and append only files (AOFs), like the status of the last RDB save operation, which provides clarity on data volatility, and the status of the AOF rewrite operation, which gives you insights about how much data you would lose if a failure occurred at a given point in time.

Replication details
Redis databases engage in replication activities that involve slave Redis servers copying and syncing data from the master. This ensures data is never lost entirely if the server breaks down. Monitoring the replication process can ensure data integrity.
Applications Manager provides you with details on the replication process, such as the master host, master port, and status of the link. With this information, you can get an overall idea of the status of the replication servers. Applications Manager also tracks the number of slaves involved in the replication process. This helps manage read-heavy Redis databases.

Ensuring your Redis database is performing optimally requires continuous monitoring and troubleshooting errors if they occur. Applications Manager offers out-of-the-box Redis performance monitoring with in-depth insights that allow you to easily identify issues in the database and fix them before your system is overwhelmed.
Looking to optimize Redis performance? Begin now with a free, 30-day trial of Applications Manager.


Good one