Key MongoDB metrics to monitor using Applications Manager
MongoDB is an open-source NoSQL database management system that stores data in JSON-like documents and works without a schema. It's a flexible, cross-platform database solution that uses a document-oriented architecture to store and retrieve data, and it's known for its high scalability, performance, and fault tolerance.
MongoDB monitoring is the process of tracking the health and performance of MongoDB servers to ensure high availability and to easily maintain MongoDB deployments. Monitoring MongoDB enables you to keep track of critical MongoDB metrics that play a major role in determining database performance. It can also help you understand capacity and resource utilization.
In this post, we will delve into the importance of monitoring MongoDB databases and how you can use Applications Manager to track key metrics and ensure the smooth operation of your database environment.
Why monitor MongoDB?
Since MongoDB is simple, lightweight, and known for its massive data storage and load balancing capabilities, many organizations (mostly start-ups) have started to turn to MongoDB as a go-to solution for their database needs. Given its massive capacity for data management, any form of performance degradation in storing and retrieving data—such as downtime or latency—can become difficult to manage, especially when dealing with a surge in user sessions in business applications. Moreover, collecting data from various sources and consolidating it in a single place becomes a huge burden in times of root cause analysis.
Obtaining in-depth visibility into the performance of your MongoDB databases can save a substantial amount of time and effort in optimizing database performance and enable you to quickly troubleshoot and resolve issues. Obtaining a holistic view of MongoDB metrics around the clock is key to ensuring high availability for seamless business performance; for this, having a good MongoDB monitoring solution in place becomes essential.
Challenges in MongoDB monitoring

While MongoDB is well-known for its fast and efficient data storage capabilities, there are also some difficulties in managing and monitoring them. Following are some of the common challenges observed in MongoDB monitoring:
Distributed architecture: Since data is spread across various MongoDB instances, tracking the performance of entire MongoDB databases can become complicated, and issues can arise from different instances at once.
Data organization: Consolidating data from various MongoDB instances for real-time analysis can become challenging, especially in cases of incident resolution.
Complex data structures: Since MongoDB does not store data in a tabular format and supports dynamic data structures, retrieving and analyzing data from various sources can become painful while performing queries, especially when dealing with database calls from legacy systems.
Scalability issues: Handling huge volumes of data being accessed simultaneously at faster rates might require you to scale up your MongoDB database resources for high performance, making it further difficult to manage and monitor.
Although MongoDB offers built-in monitoring utilities, like mongostat and mongotop, it's better to use a third-party monitoring solution, such as ManageEngine Applications Manager, especially for complex MongoDB deployments. Applications Manager can monitor MongoDB health along with that of other infrastructure elements, giving you a comprehensive view of your entire IT infrastructure. This lets you identify issues and get to their root cause faster. Applications Manager offers features like customizable dashboards, real-time anomaly detection, and automated alerts. Its proactive approach to monitoring can help you address problems before they impact users.
Key MongoDB metrics to monitor
When it comes to MongoDB monitoring, there are a multitude of metrics that need to be monitored to ensure high availability and optimum performance. Below are the list of key metrics that you can monitor with Applications Manager:
Database status and health
Ensuring high availability for your databases should be the first and foremost thing you prioritize in your business infrastructure. Since there are numerous databases running simultaneously in your infrastructure, identifying the ones that are down or inactive can become painful, especially when it comes to dealing with multiple databases issues at a time.
Applications Manager's MongoDB monitoring enables you to track the health and availability of your MongoDB databases in your infrastructure in real time. It ensures your database instances are up and running 24/7 and triggers instant alerts in case of downtime. With the help of the Infrastructure View, you can obtain comprehensive visibility into the health and availability of the database instances present in your cluster along with the memory utilized and the network traffic processed by individual database instances. This gives you a clear picture of the overall functioning of the database clusters in your business infrastructure.


Resource usage statistics
Keeping tabs on the resource utilization of a database server is essential when it comes to managing multiple databases in your infrastructure. Resources that are utilized beyond the required limits can lead to unwanted performance degradations and capacity issues, making it painful to troubleshoot the actual cause of the issue in case of escalations.
With Applications Manager's MongoDB monitoring, you can keep a constant eye on the utilization stats of your system resources being used by your MongoDB database. Applications Manager tracks the performance of your MongoDB servers by monitoring key resource usage metrics, such as CPU utilization, memory utilization, and the network traffic processed by your database instance, and notifies you instantly in case of abnormal utilization values.
Moreover, you can get a detailed overview of the database statistics of individual MongoDB database instances, including the number of collections, objects, and indexes as well as the data size, index size, and file size, to obtain a clear picture of how each database is performing and to plan capacity accordingly.


Database operations
There are instances where your database might struggle with unnecessary performance issues, leading to slowness overall. Although your database might be up and running, the operations performed by it might be causing slowness. If unattended, these issues could cause huge performance degradations, leading to unnecessary downtime and impacting overall business operations.
Applications Manager makes it easy for you to keep a close eye on the database operations performed by your MongoDB databases in real time, and it also provides deep insights about them. By tracking the various KPIs related to database operations, you get insights into how applications are performing in your MongoDB environment, and you get instantly notified whenever those metrics are not functioning as expected. Following are some key database operation metrics that are monitored in Applications Manager:
Response time: Indicates the time taken for the MongoDB database to respond to requests from various users accessing the database. Applications Manager allows you to track the response time of your MongoDB database and provides a clear picture of how your database is responding in real time.

Query statistics: Examining the amount of queries handled per second reveals a lot about the handling capacity of your MongoDB database. Applications Manager enables you to keep track of the number of queries processed by your database based on various query types to estimate the amount of load handled on a daily basis and to plan capacity accordingly, if needed.

Latency details: Calculating the time taken to store or retrieve data from your database explains a lot about the efficiency of your MongoDB database. With Applications Manager, you can obtain a clear idea of the amount of delay observed in the read or write requests performed by your database, enabling you to quickly troubleshoot any issue and take necessary steps to minimize the delay in case of higher values.

Connections: Finding out the number of connections to your database is important to understand how applications are communicating with your MongoDB database. Applications Manager provides detailed insights into the number of connections that are currently available as well as the ones that are currently in use to give you a clear understanding of the connection patterns and to identify slow or heavy connections from your applications.

Page faults: Systems running with data size beyond the available virtual (RAM) memory can result in data being accessed from the disk, leading to a page fault. An increase in the page fault value can indicate your virtual memory is full, forcing the database to read or write from the disk and leading to a slowdown in database performance. With Applications Manager, you can keep a close eye on the page faults that have occurred in your database to help you identify when data is being read or written from the disk instead of from virtual memory, indicating the need for memory optimization.

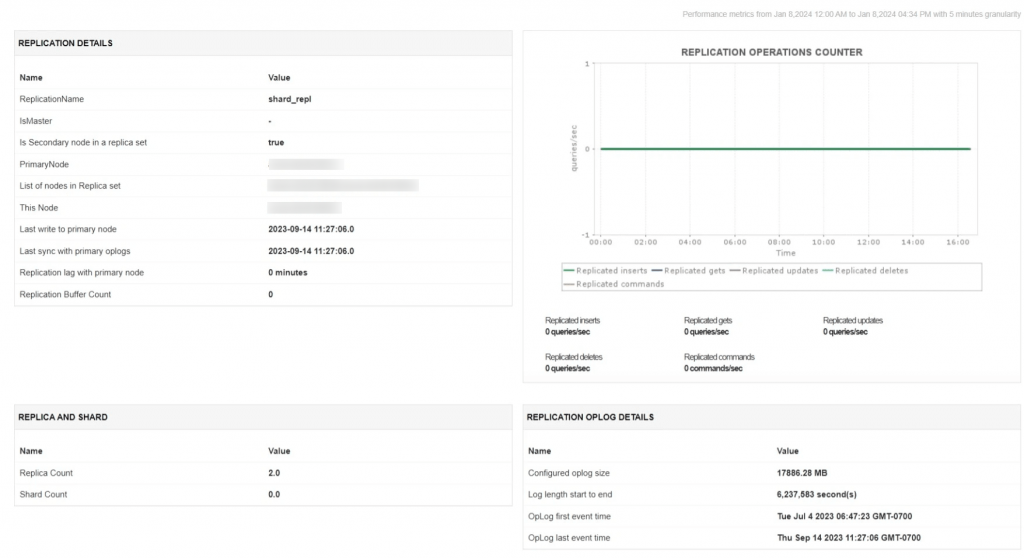
Replication statistics
When it comes to working with multiple database instances, replication plays a major role in ensuring high availability and fault tolerance while accessing your data from various locations. Keeping a close eye on the performance of replica sets is important to ensure your database is available and accessible at all times without any lags, and to maintain data consistency.
With Applications Manager, you can gain in-depth visibility into the performance of replica sets in your MongoDB clusters. It provides you a comprehensive overview of replica configuration details by listing the primary nodes, secondary nodes, and replication lag with the primary node along with details on the replicas and shards present in the database.
Get detailed insights into the various query operations that are performed per second on your replica sets along with details on the their oplog entries to obtain a clear understanding on the replication statistics of your MongoDB database instance.
Get started with Applications Manager for MongoDB monitoring
ManageEngine Applications Manager offers a comprehensive suite of database monitoring tools that go beyond just MongoDB monitoring. You can also monitor your application performance, infrastructure performance, and end-user experience—all from a single console.
If you don't have Applications Manager yet, you can download a 30-day, free trial and start monitoring MongoDB alongside the rest of your infrastructure and applications today.