As an open-source container management system, the Kubernetes (commonly referred to as K8s) platform’s constant growth warrants an intricate cluster network, making it challenging to gain system-wide visibility. Even a tiny disruption within the network could collapse the entire operation, resulting in the failure of dependent applications. Businesses that rely on such containerized applications may experience a huge impact in revenue. This makes it crucial to keep an eye on the Kubernetes infrastructure with the aid of a monitoring tool.
What is Kubernetes monitoring?
Kubernetes monitoring is the act of tracking the availability and activity statuses of critical components—pods, nodes, services, and Persistent Volumes (PVs)—within the cluster infrastructure. Understanding resource distribution and how effectively various components interact with one another is easier with the help of Kubernetes performance monitoring. Monitoring K8s plays a huge role in preventing downtime of containerized applications.
Deploying monitoring software helps simplify the process of tracking every Kubernetes object as the infrastructure can be elaborate and complex. It’s important to carefully choose the best Kubernetes monitoring tool to detect various Kubernetes issues preemptively and help counter them by providing complete visibility into the cluster.
So, what should you look for in a Kubernetes monitor?
5 best practices for Kubernetes monitoring
Here are a few basic capabilities that every Kubernetes monitoring service should possess in order to understand the relationship between each cluster element and how efficiently the clusters are operating:
1. Kubernetes cluster monitoring
When choosing a Kubernetes monitoring tool, you should always ensure that it has the capability to cover all components of a Kubernetes cluster. Foremost is the capability to provide intelligent reports of K8s’ health and availability statuses. Cluster resources, such as CPU and memory, are valuable assets that determine the complete workload capacity of the entire infrastructure.
It is important to employ the services of Kubernetes monitoring tools like ManageEngine Applications Manager to keep a close watch on cluster resource usage. This practice helps admins make the necessary optimizations to increase the overall efficiency of the CPU and memory. In the long run, monitoring Kubernetes cluster resources helps maintain and reduce operational costs.
Individual cluster components should also be monitored on a regular basis to prevent any outages. Having the health status of each component displayed makes it easier to perform analysis and fault management.
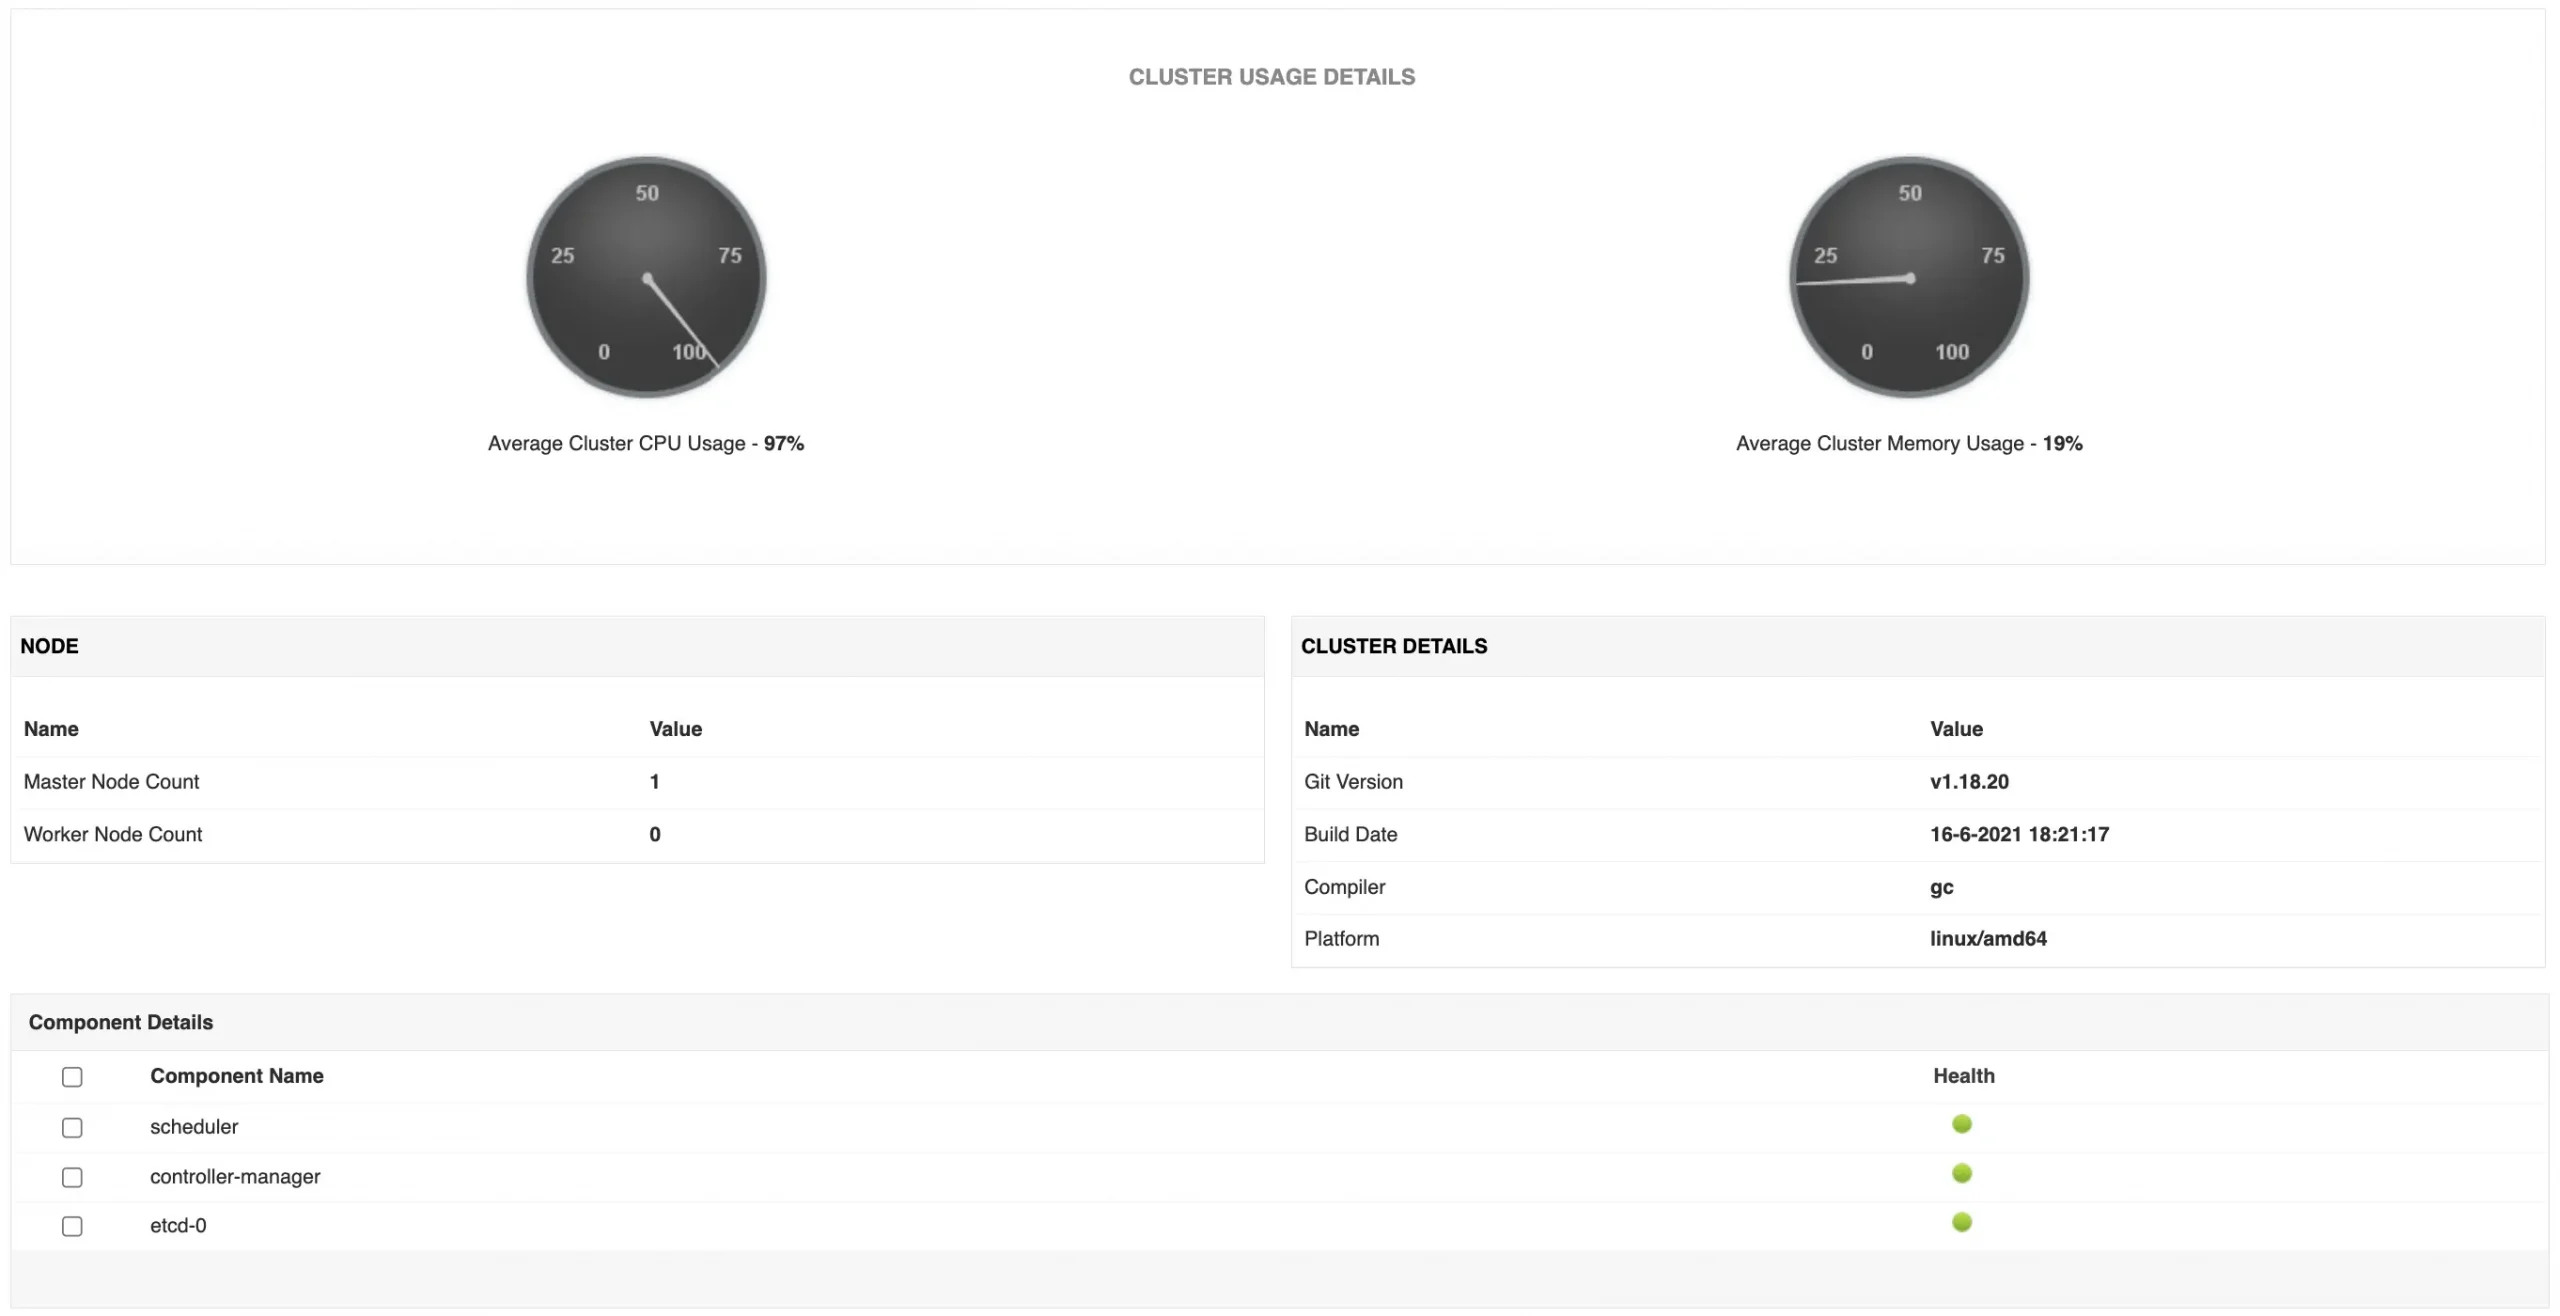
Metrics to monitor: Cluster health, availability and performance, CPU usage, Memory usage, cluster component health and stats, and namespace availability.
2. Kubernetes node monitoring
Understanding the operating capacity of Kubernetes nodes can help admins gain insights into container resource allocation and consumption efficiencies. As the container workload increases, additional resources might be needed that could cost the organization more money. Having pods taking up excessive nodal resources might make those resources unavailable for other service operations and could potentially slow down the application. In this situation, having a clear plan for resource allocation would enable Kubernetes pods to make the best use of resources while also ensuring room for more pods.
Applications Manager helps tackle inefficient resource allocation by providing insights on nodal resources. The Node section of the tool can be used to reveal the CPU and memory details of the nodes being monitored. It displays nodal metrics such as CPU and memory limit, request, allocatable resource count, and the overall health of each node. The Kubernetes dashboard also provides details on the master and worker nodes within the cluster that help obtain a clear picture of the system’s workload capacity.
Applications Manager also gives a statistical report of the Top 5 nodes based on CPU and Memory Limit and request rates. This can be useful in identifying nodes whose request has exceeded the limit as they could affect or slow down the containerized application.
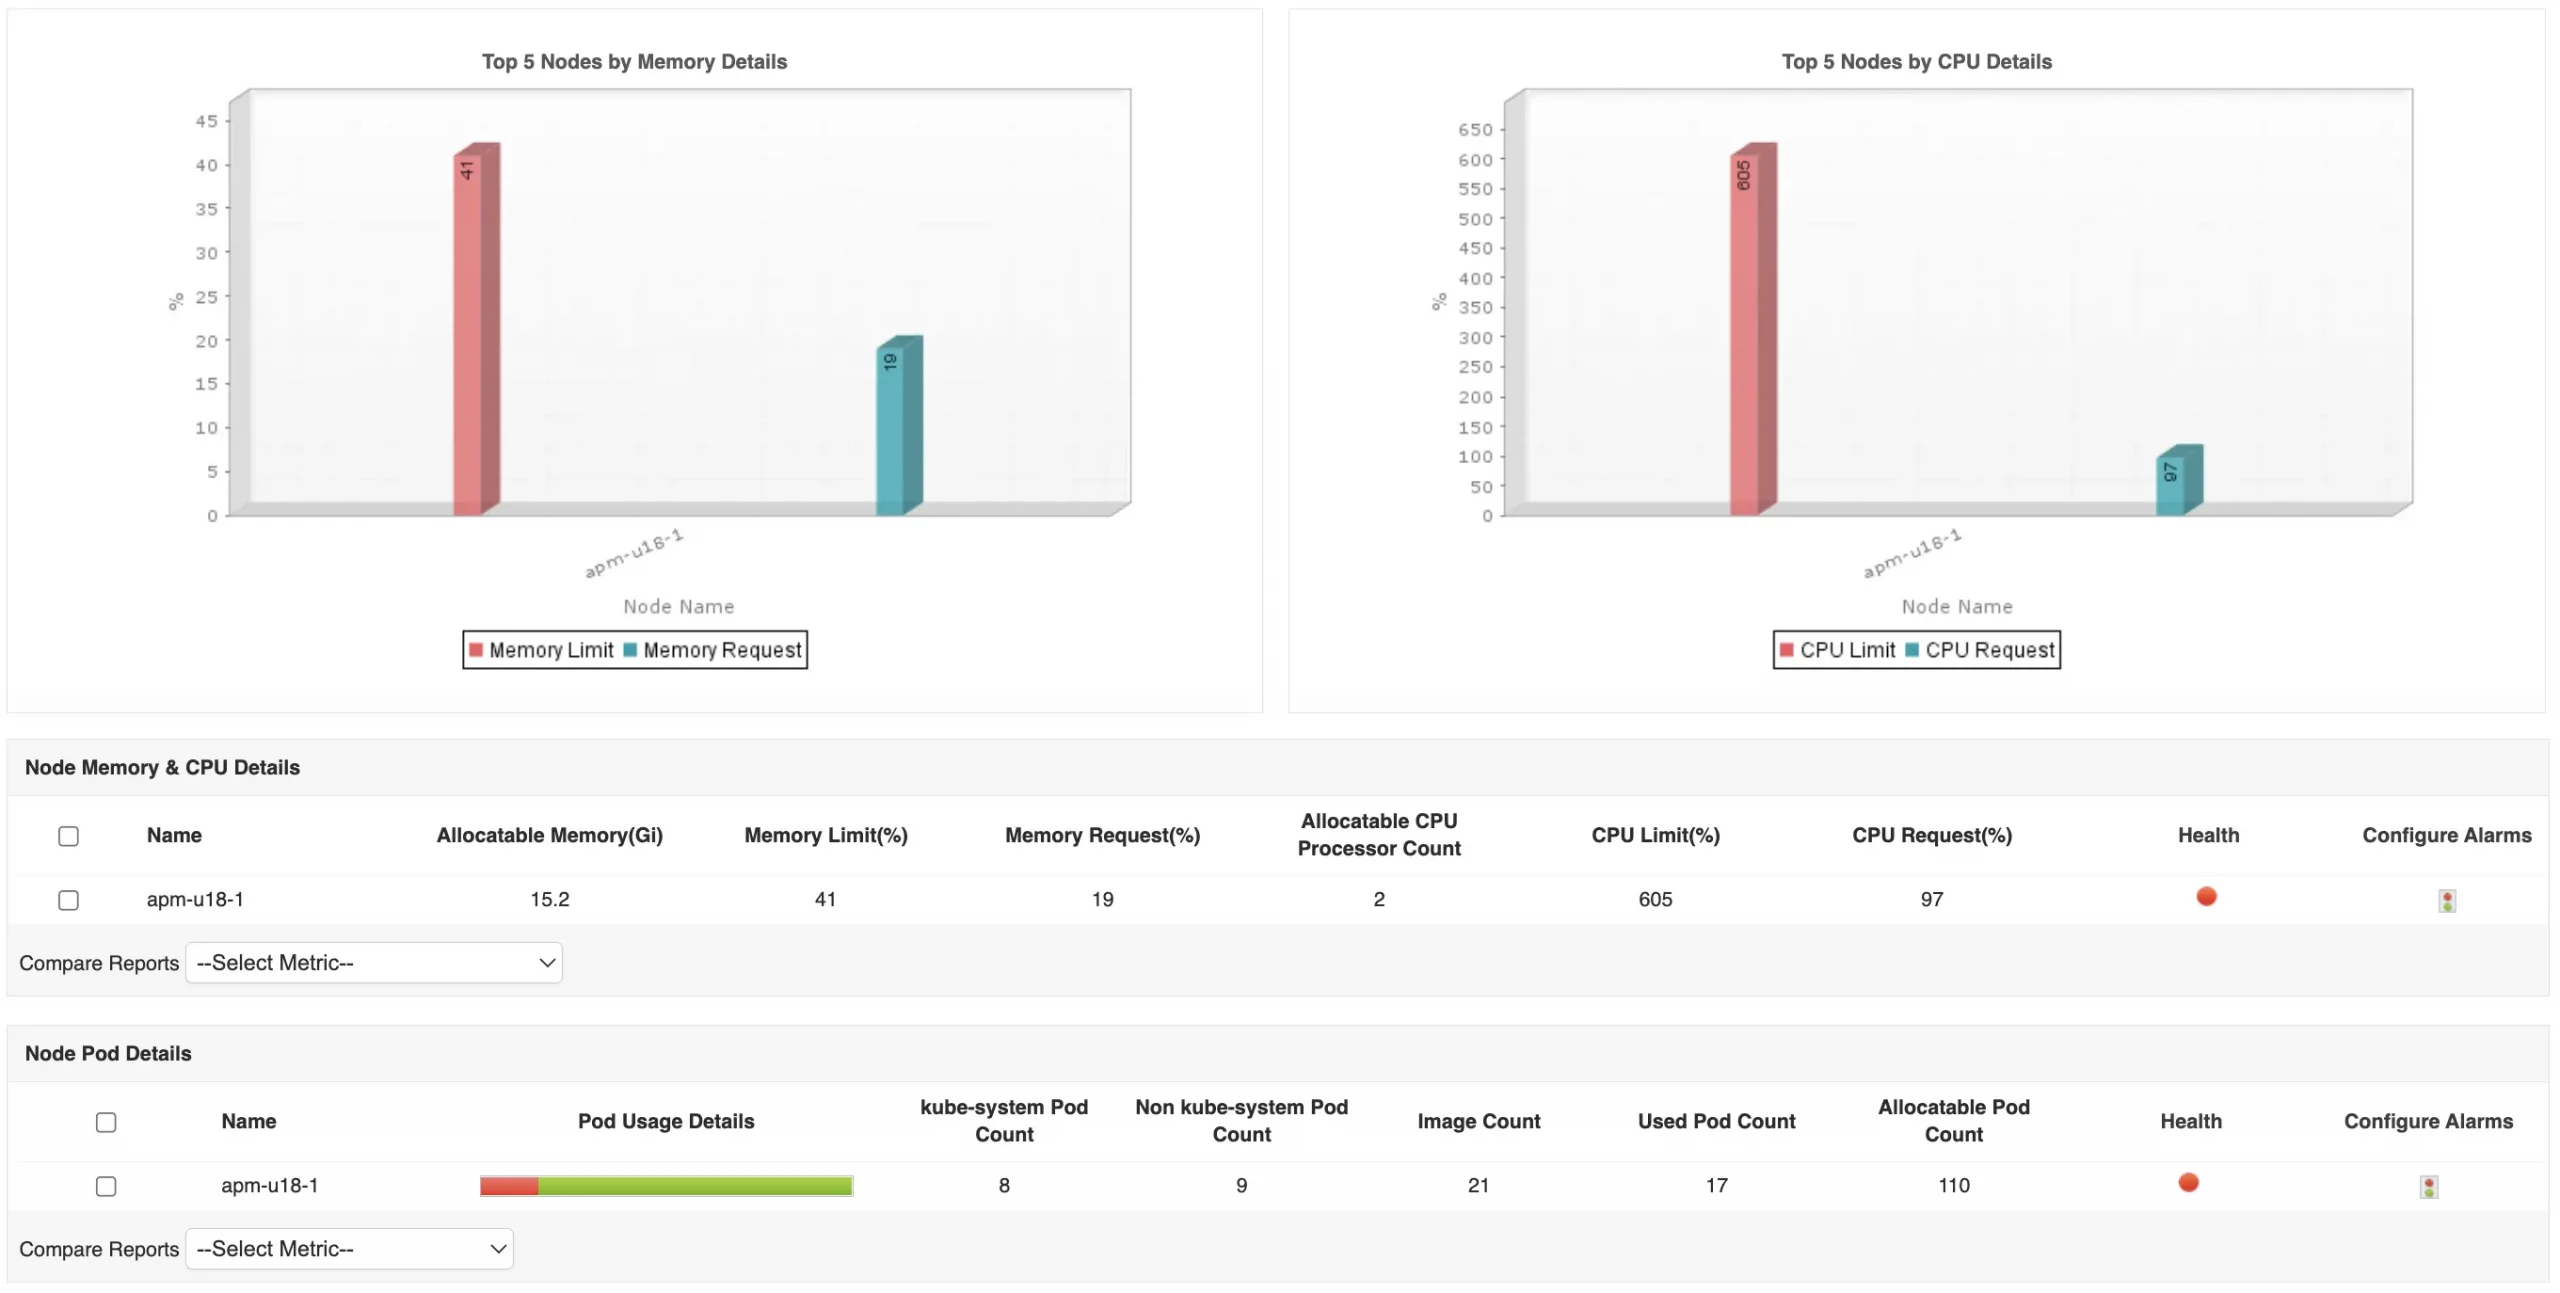
Metrics to monitor: Health of node, master and worker node count, allocatable memory size (Gi, often associated with a gigabyte as 1GB = 0.93Gi), allocatable CPU processor count, CPU limit and request, memory limit and request, node’s pod usage level, image count, Kube-system and non-Kube-system pod count, OS, architecture, ephemeral storage size (Gi), and creation time.
3. Kubernetes pod monitoring
One of the contributing factors leading to application unavailability is the lack of pods within a node to assign workloads. This commonly occurs whenever all the allocatable pods are being used. Applications Manager can constantly track the used pod count to help ensure that it doesn’t exceed the maximum allocatable limit that might cause application outages.
Tracking every Kubernetes pod can be tedious as there could be many active workloads in a single container environment. It’s even harder to identify problematic pods that could be facing errors for innumerable reasons. Applications Manager’s Kubernetes pod monitor lists every pod within the cluster and its current activity status (Running, Succeeded, Completed, Terminated, Failed, Unknown) to help troubleshoot potential issues. By applying the status filter, admins can easily pick out the problematic pods for further analysis.
A detailed breakdown of every pod is necessary to understand their connection with other Kubernetes objects. Applications Manager is one such tool that supplies admins with information about a pod’s relationship with the node, application, namespace, and container. This makes it easier to map different objects and identify errors like validation, ErrImagePull, and CrashLoopBackOff errors.
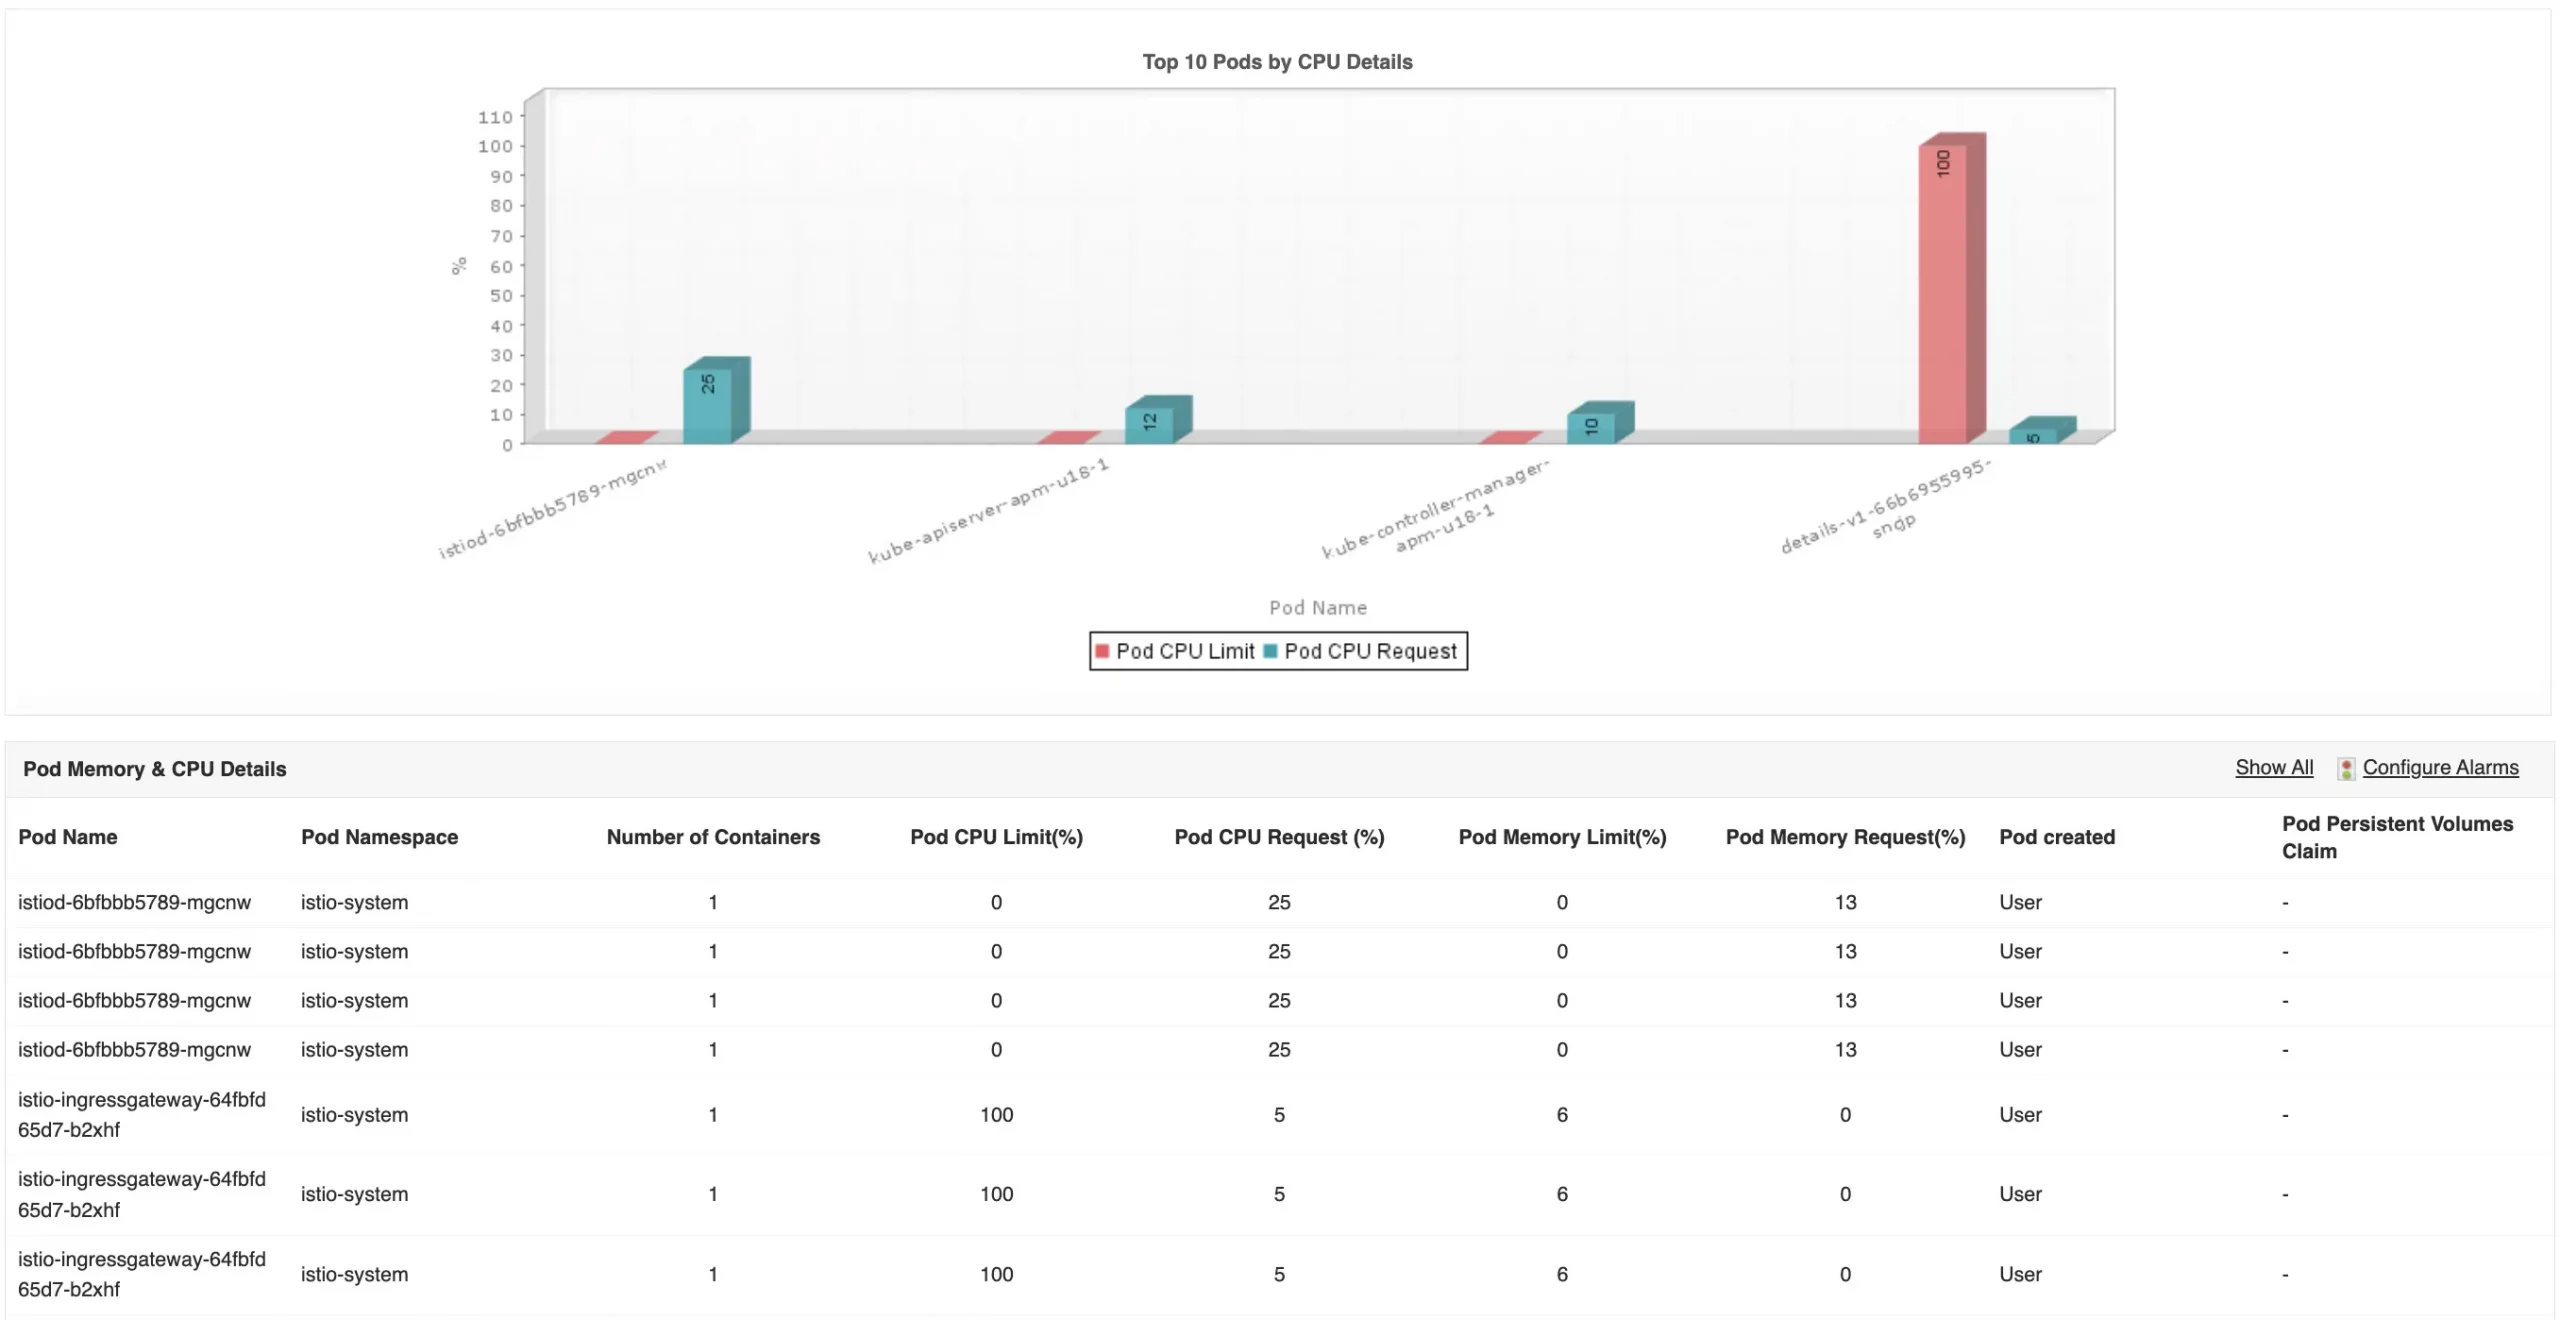
Metrics to monitor: Name, namespace, associated node name, application, type, creation time and type, pod activity status, container count, CPU limit and request, memory limit and request, Persistent Volume Claim (PVC), container image, container restart count, and container activity status.
4. Kubernetes services monitoring
Kubernetes can evenly distribute traffic across the network to facilitate smooth deployment and load balancing. There are different types of services that perform a specific function to address the need of different applications. Using Kubernetes monitoring tools like Applications Manager, it is important to understand the types of service associated with the respective application.
The primary responsibility of each service is to ensure that pods have access and connectivity across the network. Applications Manager lists the network services that can help ensure that the pods are listening to the right port without any interruptions. It also makes it easier to discover if a service exists, especially when dealing in bulk, as there is a possibility that service creation can fail at times.
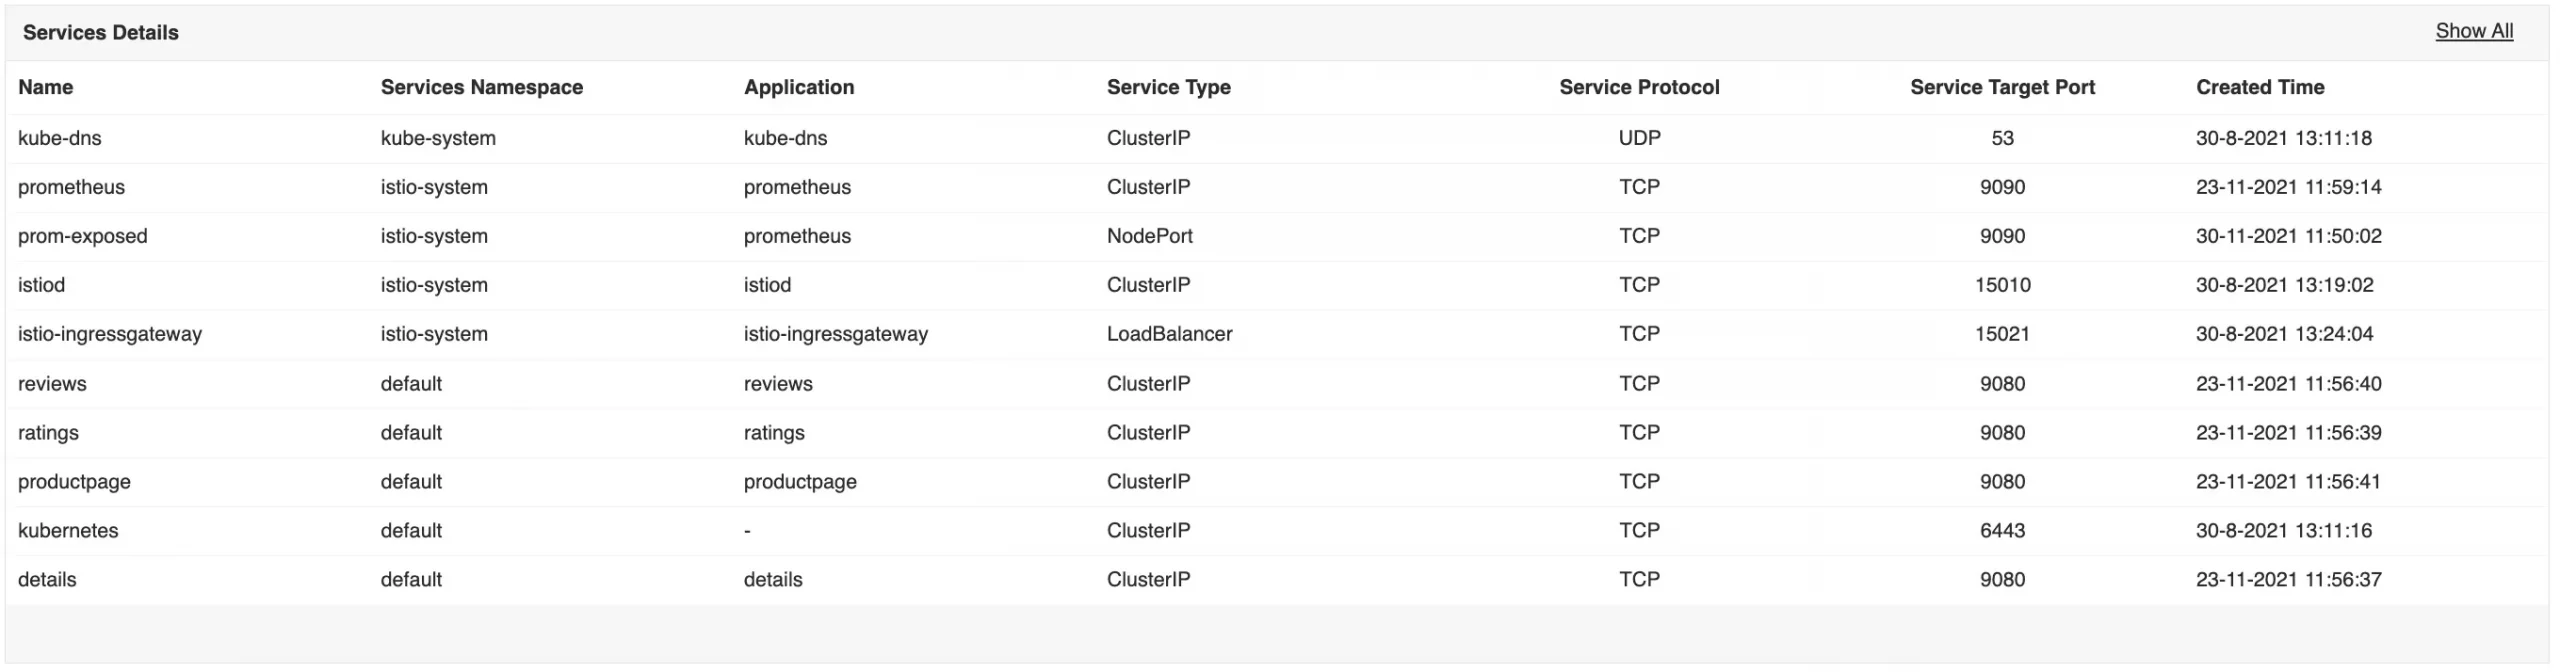
Metrics to monitor: Name, namespace, application, type, protocol, target port number, creation, and deployment details.
5. Kubernetes PV monitoring
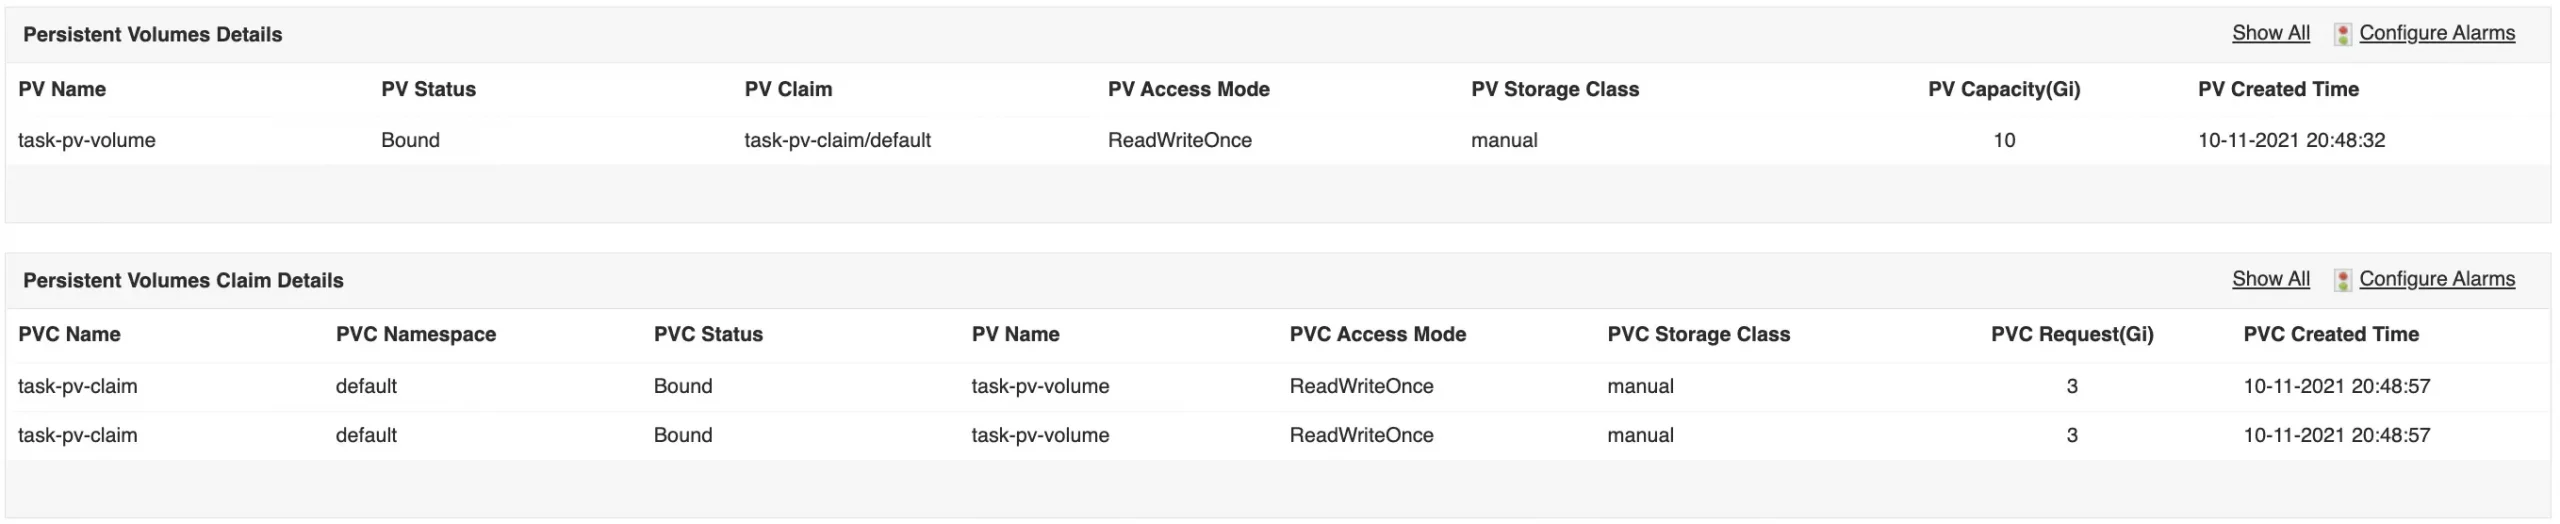
Persistent Volumes (PV) are ephemeral storage units that retain data even after the lifetime of a pod and can withstand pod restarts and failures. Even after restarting the application, the pod will still have access to previously stored data, making it highly reliable. However, if the Persistent Volume Claim (PVC) associated with PV doesn’t get removed and remains under Terminating status, the PV might not be available for further use. Having an idle PV for too long could cause disruptions and delays within the container operations.
Kubernetes monitoring tools such as Applications Manager can be used to track the binding status (Bound, Terminating, Free) of a PVC and its associated PV. The monitor also provides in-depth information about each PV and PVC to understand the type of storage operation and their relation to each other. When a pod is still holding up a PV, admins can use the monitor to identify the pod associated with the PVC. The pod can then be removed to allow the PV to be used again. Additionally, the storage class of each PVC should be monitored as those without a storage class can fail. These capabilities are important to ensure that PVs are always in full operation mode, and don’t incur any operational loss.
Metrics to monitor: Name, namespace, activity status, access mode, storage class of PV and PVCs, PV capacity limit (Gi), and PVC request size (Gi).
Conclusion
Providing 360-degree coverage of your K8s ecosystem prevents containerized applications from experiencing performance setbacks and disruptions. With the wide range of Kubernetes monitoring solutions in the market, it is wise to choose one that covers as much ground as Applications Manager. In addition to tracking Kubernetes components, this application performance monitoring solution delivers out-of-the-box support for your entire IT stack. It provides monitoring solutions for more than 150 technologies—both on-premises and in the cloud.
ManageEngine Applications Manager can be easily configured for Kubernetes monitoring in just a few minutes. Download a FREE 30-day trial now!
You can also schedule a free, personalized demo with one of our solution experts to receive answers to your product-related inquiries.