
With large enterprises increasing their focus on public cloud providers, Microsoft Azure continues to have a strong foothold in the hybrid cloud industry. Azure adoption increased a whopping 11 percent last year from 34 to 45 percent, reveals the latest survey by RightScale.
Azure’s managed cloud database, Azure SQL Database, is a frontrunner when it comes to meeting the demands of both on-premises and cloud services. However, from an IT admin’s point of view, monitoring Azure SQL Database comes with its own set of challenges including memory problems, high CPU usage, lack of resource planning, and poor queries.
Here are the top four challenges of monitoring Azure SQL Database:
Blocking queries
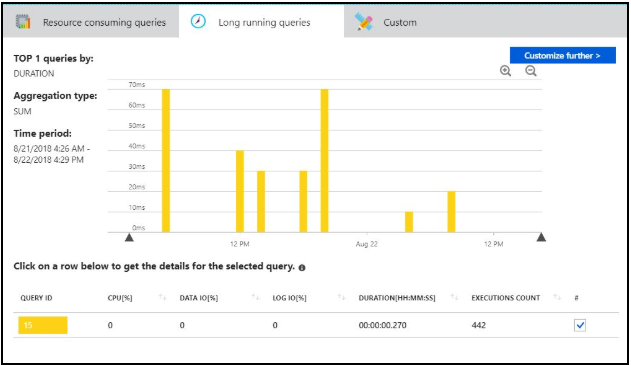
Blocking is an unavoidable characteristic of Azure SQL Database, but too much blocking can cause connections to wait longer than they need to, which hurts the overall performance of your application. Identifying blocked queries by obtaining in-depth information about wait times, holding historical long-running and blocked queries, and receiving alerts when queries are blocked can all help speed up application performance.
Planning resources
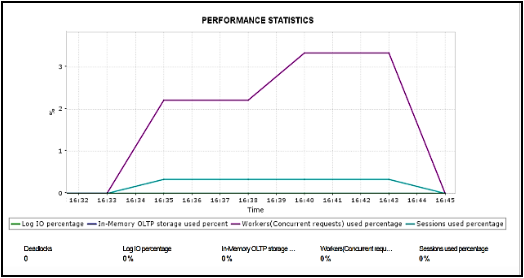
Many Azure admins find it challenging to ensure resources are properly utilized and to plan capacity for future scaling. It’s vital to monitor key performance metrics to prevent any potential performance degradation caused by underutilized or overutilized resources. The most common Azure SQL Database performance problems include:
- Memory bottlenecks: Memory bottlenecks can lead to delay in application response, overall system slowness, or even application crashes. It is well-known that SQL servers are memory hogs and if not monitored properly, they might lead to a lull in performance. So, it’s vital to identify the applications that utilize the most memory and the systems that are running with insufficient memory. It’s also critical to track key performance indicators like DTU usage and R/W utilization to determine whether the allocated resources are maxed out. Receiving alerts when memory is under- or overutilized and tuning queries can also help.
-
CPU bottlenecks: Insufficient hardware usage, sudden CPU spikes, as well as complex and time-consuming queries are some of the reasons for CPU bottlenecks. Gathering information about CPU utilization will help you track the general efficiency of your database.
Tracking lock contention
When numerous processes request access to the same database resource at the same time, you’ll run into SQL server conflicts and eventually lock contention. A few tricks that can help prevent lock contention are things like tracking the lock waits that indicate data contention, keeping transactions small, and updating SQL before a transaction.
A deadlock occurs when two separate processes compete for resources held by one another. Accessing tables in the same order and receiving alerts before deadlocks occur can help.
Identifying failed connections
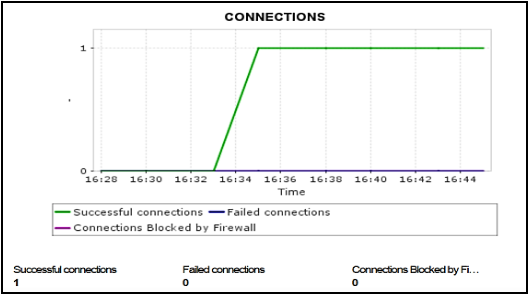
Azure SQL enforces limits on the number of connections to a SQL database and the number of concurrent requests. Doing things like reviewing connections and tracking the percentage of concurrent sessions can help tune the performance of Azure SQL Database.
Given the complexities involved in tracking the performance of Azure SQL Database, you might need a little help. Applications Manager, our monitoring solution, should do the trick. Learn more about how Applications Manager can help you monitor Azure SQL Database.