Reduce one step from your usual Server Troubleshooting Handbook.
Last time I posted about Applications Manager's ability to monitor custom applications. However today I will post about an interesting question we got in support from one of our customers. Basically it will help you reduce one step from your usual server troubleshooting handbook. Interested ? Please read on.
Can I/you generate a list of all system processes by CPU/Memory usage when a CPU threshold is violated on a Server monitor?
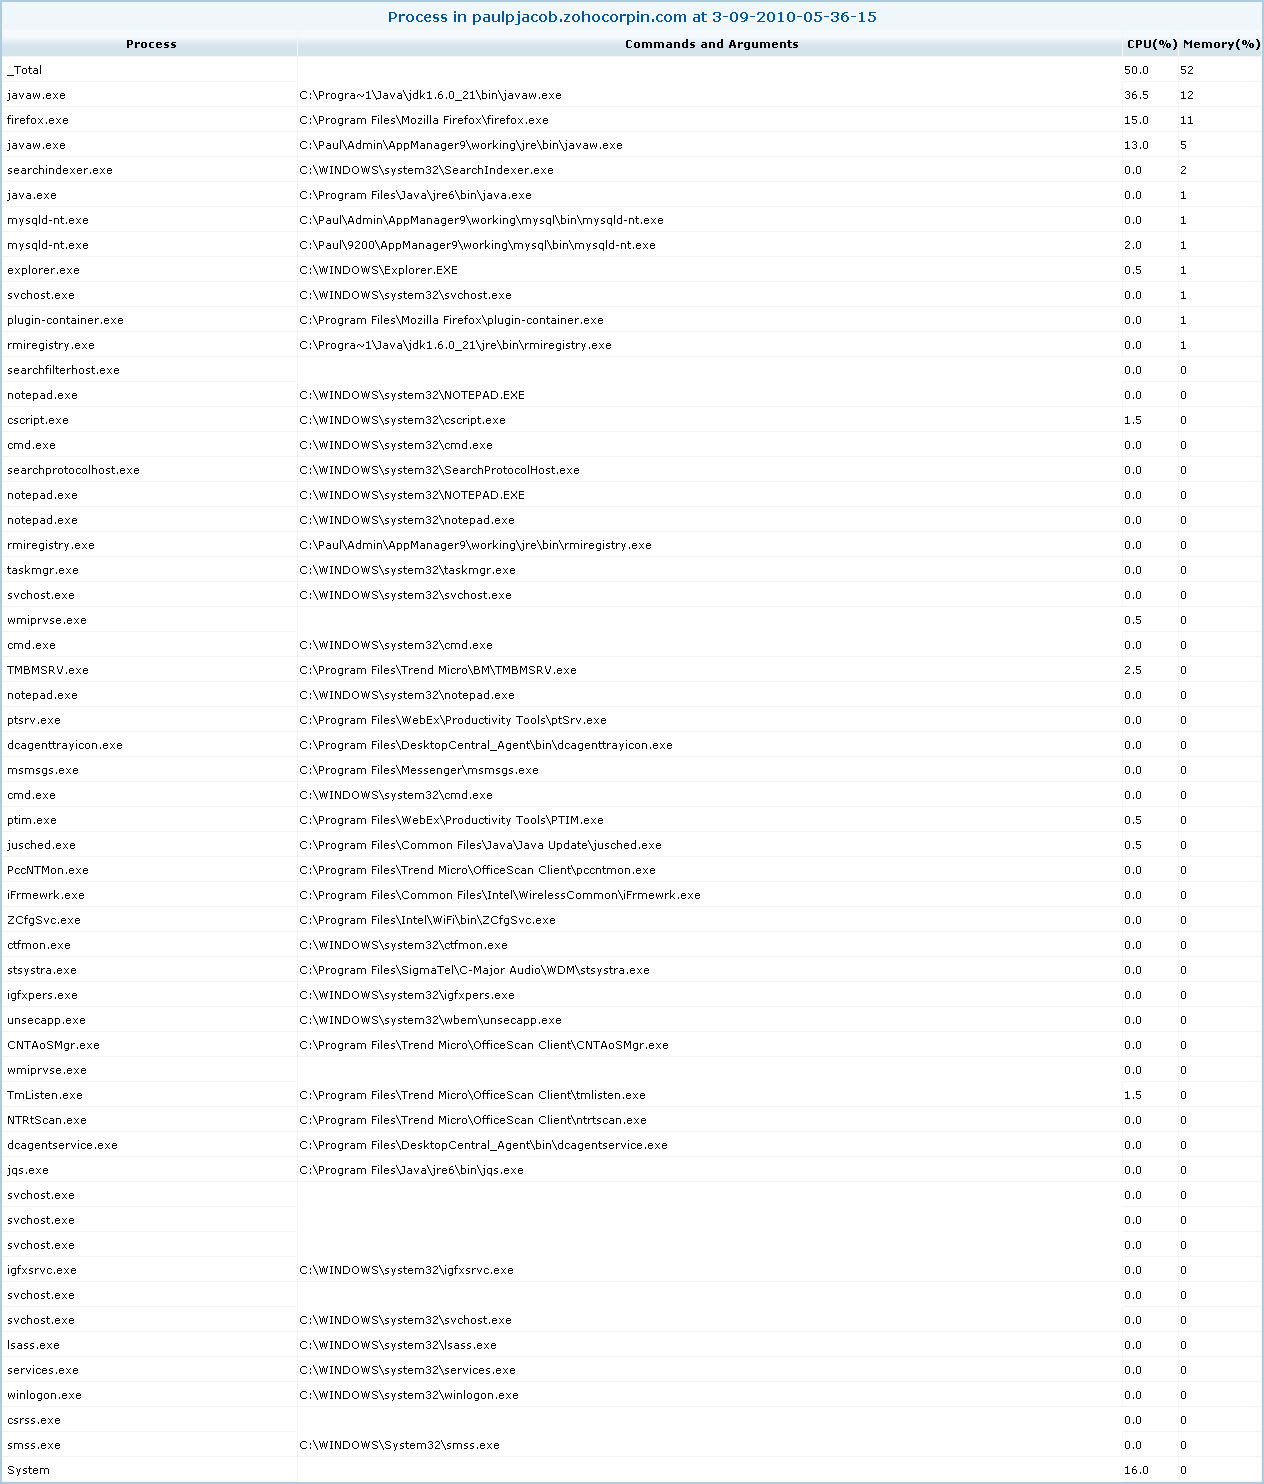
Answer is YES! We can generate a snapshot of all processes arranged in descending order based on the usage (CPU/Memory) for each process on occurrence of a CPU or Memory alert for Server monitors. This can be done by associating a Threshold and Email Action to the CPU Usage % or Memory Usage% attribute of the Server Monitor. Please refer Threshold configuration and creating Email Actions from our Online Help Document.
The alert when triggered from this setting will have a link to a report that shows the processes by CPU usage and percentage Memory used for each process arranged in the descending order, based on the usage for each process at the time the alert occurred. You can also reach the report in the Web Client, by clicking on the threshold icon from the Server monitor details page, when the monitor is in warning / critical status.

This snapshot view could assist us in determining the server process that could have caused the unusually high CPU Usage . It will then help you take remedial action accordingly, which I believe should be really handy when configured for all busy servers as it will reduce one troubleshooting step.
As always, if there is something that you think will make life easy for you while using Applications Manager, do post your comments or vote your idea up, via our community portal.
Thanks & Regards,
Paul Jacob
