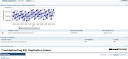
Troubleshooting Application Performance - A proactive approach
Every organization has its own Applications ( be it critical or non-critical ) to monitor and they have their own teams to administer these applications. Not all team members has the same level of expertise to troubleshoot the application errors. With ManageEngine Applications Manager, this is possible at any level.
[ This is a live situation that happened a few weeks ago in our Client office. We were elated to find out that with Applications Manager, there were able to find out the root cause of the issue and were able to fix it within minutes of identifying the root cause. ]
Let us take an example here to see how ManageEngine Applications Manager helps technicians to troubleshoot application errors.
Payroll System :
This system should have a frontend JSP / ASP web page and a backend MSSQL or Oracle Database. Let us fine drain this to have a JSP frontend through Tomcat Server and a MSSQL database,both the components residing on two different physical servers.
Let us say a user reports to the Payroll Administrator that the application is responding too slow that the login takes around 2-3 mins.
The Payroll Administrator has to now login into the application to validate the incident. Though it may or may not be slow to the Administrator, he has to now resolve the issue for the end user. With ManageEngine Applications Manager in place, the Administrator can get an holistic approach on the performance of the Application.
The Administrator can look for the following through ManageEngine Applications Manager while working to troubleshoot the application performance :
1. Check whether the CPU / Memory of the Server is normal.
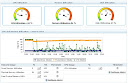
The screenshot shows that the Memory has shot up to 94% and is always a constant at this value. This may have violated the Threshold value and indicates that there is a performance issue.
2. Now, the next area to troubleshoot is the Tomcat Server. On analyzing the tomcat server parameters, it has been found that the Used Memory of the application is 13 MB while the total memory allocated is 18 MB.
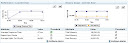
On further analysis, the administrator finds that there are 25 Current Threads for a particular connector which causes the memory to shoot up.
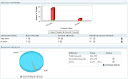
3. The analysis is still not complete. The Administrator drills down further to find out why the Memory used by the Tomcat Server was close to 75 %. The next area to look into is the MSSQL database.
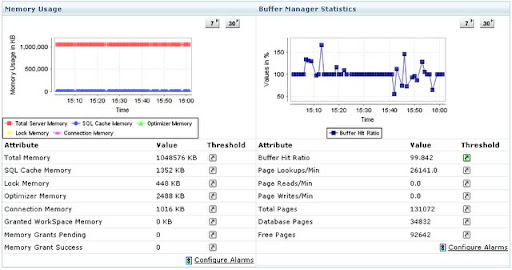
Observing the above screenshots, the administrator concludes that the Root cause for the slow performance of the payroll application is due to 70 Active Connections per min, while the optimum value should have been at 30. There were unwanted connections by end users to the DB Instance, which has caused a degradation in the performance of the application. [ Refer my blog "Thresholds & Managing Application Performance Proactively" for more details on configuring Thresholds to various parameters ]
Now, the next question is that “Should I have to go into each of these monitors every time, an issue is reported?”. You should have guessed the answer right. The answer is “No”.
See the various approaches which help you to be more proactive than reactive, when such incidents are reported.
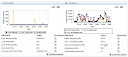
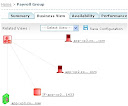
1. You can group these monitors to create a Business snapshot view. The detailed view gives an at-a-glance performance of all the monitors.
2. You can create a dashboard view for these monitors and publish the dashboard on a plasma screen.
The below code snippet is an example to publish your dashboard view.

The option to publish the dashboard is available through Actions -> Publish Dashboard from the Dashboard view.
3. You can include troubleshooting documents for various errors associated with the application performance.
You can extend the same steps to troubleshoot any other application error through Applications Manager. Applications Manager follows a pro-active approach and helps ease out Administrator job functions by automatically co
rrecting the errors through custom scripts or programs.
I believe this document serves as a guide to help any administrator to troubleshoot application performance and errors through ManageEngine Applications Manager.
Kevin