
Deadlocks and blocks are two types of concurrency issues that can occur in an SQL Server environment. Understanding and addressing these issues is crucial for ensuring the performance and reliability of your SQL-based applications.
First, let’s look at the concept of locks, blocks, and deadlocks.
Locking is a mechanism that SQL Server uses to maintain data consistency and integrity. It’s a way to control concurrent access to data by multiple transactions. As a real-world example of locking, think about a bookstore where everyone shares the same list of books. When someone wants to borrow a book, they ask to lock it on the list so others can still see it but can’t borrow it until it’s returned. Once it’s back, the lock is removed, and someone else can lock it to borrow.
Blocks
Blocking is a common consequence of the locking mechanism. Blocking happens when one transaction holds a lock on a resource, preventing another transaction from acquiring a conflicting lock on the same resource. This situation arises when one transaction is waiting for a resource currently held by another transaction, causing the waiting transaction to be unable to proceed until the necessary resource is released. This waiting state is known as blocking. Extending the bookstore example, let’s say there’s only one copy of a certain book. If customer A and customer B try to borrow it at the same time, customer A gets permission to borrow it (exclusive lock), and customer B has to wait until it’s returned (block).
Deadlocks
A deadlock is an undesirable situation that can lead to major performance issues. A deadlock happens when two or more transactions are stuck, each waiting for the other to free up a resource. This causes a scenario where the transactions cannot move forward, resulting in a deadlock.
Deadlocks can occur due to transactions running simultaneously and conflicting over shared resources, like tables or rows. As a result, the transactions cannot proceed, leading to a circular dependency.
Taking the bookstore scenario again, let’s say there are two people, Angela and John. Angela has locked book A and wants to lock book B, while John has locked book B and wants to lock book A. They’re both stuck waiting for the other to unlock the book they need, causing a deadlock where neither can move forward.
Though locking, blocking, and deadlocking are related concepts, each carries its own weight and path.
Locking keeps data where it belongs in busy places. It’s not good or bad—SQL Server databases must work right.
Blocking happens when locking holds things up. It might slow things down, but it’s how databases make sure everything stays in line.
Deadlocking is when things get stuck in a loop, waiting for each other to let go. It’s bad news for databases and needs fixing fast to keep things running smoothly.
Navigating deadlocks: Understanding their mechanisms
Now that we have established deadlocks as the bigger concern compared to locks and blocks, let’s look at how deadlocks are formed in SQL Server. Deadlocks may arise within a system when the following four conditions are met concomitantly:
-
Mutual exclusion: Resources can only be held in an exclusive mode. This means that resources can only be utilized by a single process at any given time.
-
Hold and wait: A process must be holding at least one resource and waiting to acquire an additional resource that is currently held by another process. This means, that to acquire or utilize a resource that is being used by another process, the former process must wait until the latter process releases the resource. The former process will hold the resource it had been using until the latter process releases the resource it needs, resulting in a deadlock.
-
Resource revocation: A resource cannot be forcibly taken away from a process; it can only be passed on when the process holding it releases it voluntarily.
-
Circular wait: A situation where two or more processes are each waiting for a resource that is held by another process in a circular chain. Due to the hold-and-wait rule, when two or more processes require a resource from each other, none of the processes receive the resource, resulting in a deadlock.
Anticipate and respond: Use a monitoring tool to identify potential deadlocks and blocks
Deadlocks can hit end users hard, and the more they happen, the harder the blow. The key effects of deadlocks and blocks include:
-
System standstills due to lack of progress made by the locked processes.
-
Resource wastage, as a resource, cannot be utilized by other processes when it is being held by a blocked process.
-
Reduced throughput when a system spends too much time resolving deadlock situations.
-
Increased response time, as blocked processes will need to wait to get access to a common resource.
-
System instability, as unmanaged deadlocks can lead to system crashes.
-
Data corruption is a possibility when processes are interrupted while holding resources critical to maintaining data integrity.
Monitoring these disruptive events in SQL is essential for proactively identifying and resolving them before they cause significant disruptions. By using an SQL monitor tool like Applications Manager, IT teams and database administrators can:
-
Track and analyze SQL Server performance metrics.
-
Identify potential deadlocks and blocks.
-
Take necessary actions to prevent deadlocks and blocks from recurring.
This proactive approach helps in ensuring the smooth functioning of applications and in maintaining a high level of user satisfaction.
Gaining insights: Monitor the health and performance of your SQL server with Applications Manager
Applications Manager’s SQL database monitor comprehensively tracks transactions, deadlock rates, and block details, providing valuable insights for analyzing performance issues. It goes a step further by identifying queries with extended execution times, furnishing detailed information like total block time, average block time, average execution time, and the associated database name. This functionality assists administrators in effectively pinpointing and addressing performance degradation issues.
Here is a general approach to monitoring deadlocks and blocks in SQL databases using Applications Manager:
-
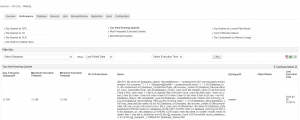
Monitor overall SQL server performance: Leverage our SQL monitor to assess query performance and pinpoint problematic queries that might result in deadlocks or blocks. The Performance tab in Applications Manager’s SQL monitor incorporates tables highlighting Top Slow Running Queries, Most Blocked Queries, and Top Waits for Waiting Tasks.
-
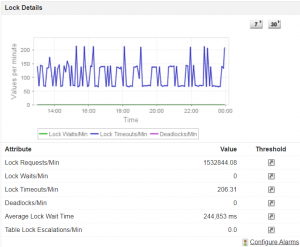
Keep an eye on performance metrics specific to deadlocks: Track essential performance metrics associated with database locks and deadlocks, such as lock wait time, deadlock count, and blocking sessions. Applications Manager’s user-friendly interface enables visualizing these metrics effectively for easy understanding at a glance.
-
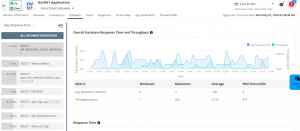
Monitor the performance of applications that depend on the SQL server: Applications Manager offers deep application performance monitoring with byte code instrumentation capabilities that enable you to gain visibility into the ongoing queries and transactions being executed within your application. Set up an APM monitor that allows you to monitor active transactions to pinpoint sluggish database calls, assess database usage, and evaluate overall database performance through detailed graphical and tabular representations.
-
Alarms and notifications: Configure thresholds and alerts within the Applications Manager to notify you about any deadlock or block issues within the SQL database promptly. Applications Manager can notify you in the channel of your choice – such as text, email, or Slack messages. This enables you to take proactive measures in addressing these situations before they cause major problems. You can also set up a threshold to show the status of the SQL monitor as Critical if the deadlock rate exceeds a limit.
-
Configure dashboards for deadlocks: Applications Manager provides many out-of-the-box reports that allow you to get real-time and historical views of the health of your SQL server instances. For example, the ‘History Report’ feature offers a comprehensive record of a specific SQL server attribute, allowing you to generate historical trends during business hours. Employ these historical reports to examine previous incidents retrospectively, recognize patterns and establish preventive measures.
With the help of ML-based deduction, the tool can analyze patterns of resource usage and predict potential deadlocks before they occur. This proactive approach allows the system to take preventive measures to avoid deadlocks. Additionally, ML can also be employed to optimize lock management strategies, such as determining the most efficient way to allocate locks to different processes.
Troubleshoot database performance with Applications Manager’s SQL monitor: Your solution for deadlocks and blocks
Leveraging the Applications Manager’s SQL monitor is pivotal for a robust and efficient database management strategy. By utilizing this powerful tool, you can gain the capabilities to identify proactively, analyze, and address deadlocks and blocks.
Applications Manager’s comprehensive monitoring and reporting functionalities provide valuable insights into your SQL server’s transaction activities, performance metrics, and historical trends. With a user-friendly interface and detailed graphical representations, our SQL monitor simplifies managing and optimizing your SQL database. Empower yourself with the insights needed to ensure seamless operations, swift issue resolution, and the overall health of your database. Utilize our SQL monitor to address deadlocks and blocks effectively, unlocking a smoother and more responsive database experience.
If you don’t have Applications Manager yet, you can download a free 30-day trial and start monitoring your SQL servers alongside the rest of your infrastructure today.