In today’s fast-paced IT landscape, efficient application performance monitoring is essential. IT teams need real-time insights, interactive data visualization, and a seamless user experience to detect and resolve issues swiftly. With the latest enhancements to ManageEngine Applications Manager’s dashboard, monitoring is now smarter, faster, and more intuitive than ever before.
From interactive Zoho Charts that simplify trend analysis to a revamped UI for effortless navigation, these upgrades will empower you to analyze data efficiently, identify performance bottlenecks instantly, and help you make data-driven decisions with confidence.
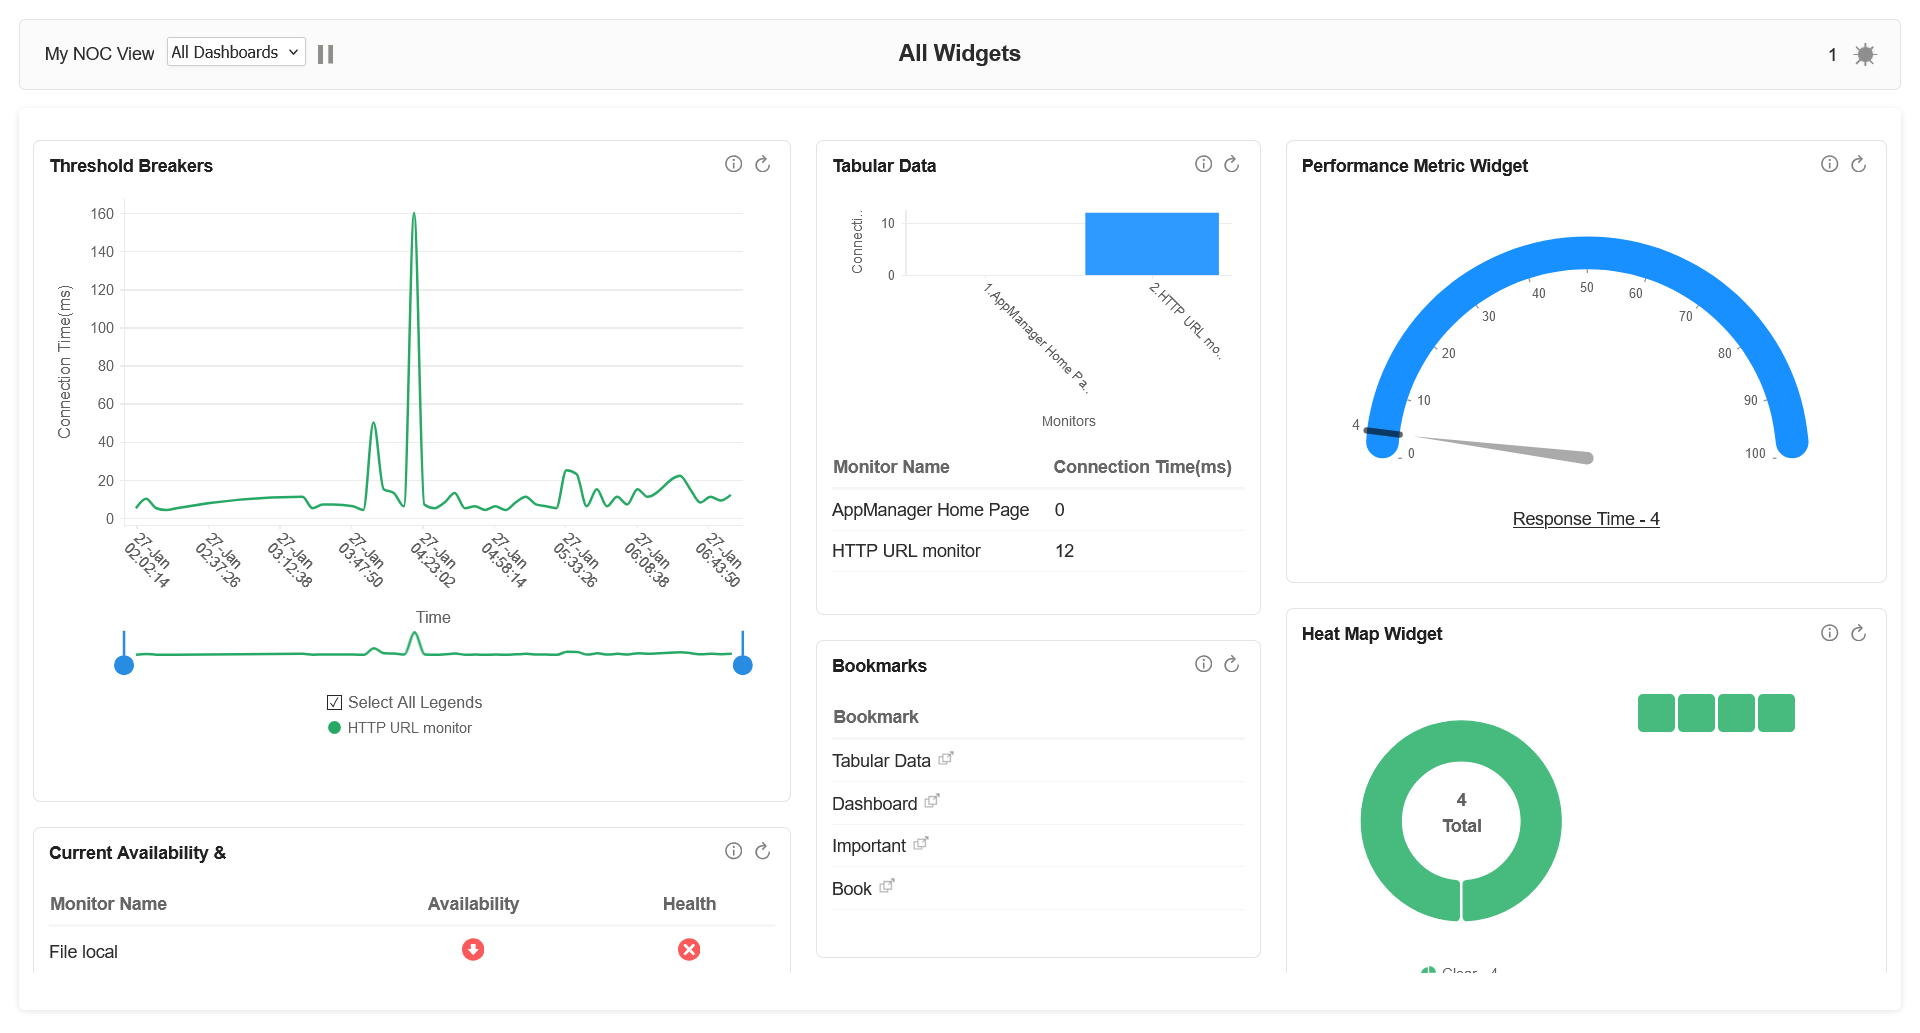
What’s changed in the new Applications Manager’s dashboard?
In our latest update, every enhancement is designed to streamline IT monitoring and optimize workflows:
1. Real-time interactive data visualization with Zoho Charts
The transition to Zoho Charts introduces an interactive way to visualize your data, making it easier to pinpoint performance issues.
-
Instant tooltips provide immediate context when hovering over data points, allowing teams to quickly diagnose spikes in server latency without manually searching logs.
-
Zoom and pan features allow you to focus on specific timeframes, making it easier to identify recurring slowdowns and spot patterns in resource utilization.
-
Dynamic animations enhance data clarity, helping you instantly recognize trends in application uptime and server performance.
By zooming into performance dips, panning across historical data, and leveraging tooltips, you can detect anomalies faster and accelerate root cause analysis—all within an intuitive and highly responsive dashboard.
2. Advanced charting features for granular data analysis
Performance trends become clearer with enhanced line, bar, and dial charts that offer better readability and deeper insights into your IT infrastructure.
-
Zoomable line charts allow teams to track critical metrics over time, such as CPU spikes during peak traffic hours, ensuring bottlenecks are identified before they escalate into major issues.
-
Scrollable legends make it easy to manage multiple metrics simultaneously so you can focus on the most relevant data without the clutter.
-
Overview charts provide a summarized snapshot, perfect for tracking long-term resource utilization trends and setting custom timeframes for performance comparisons.

With these enhancements, seamless trend analysis helps IT teams pinpoint irregularities, optimize resources, and streamline reporting.
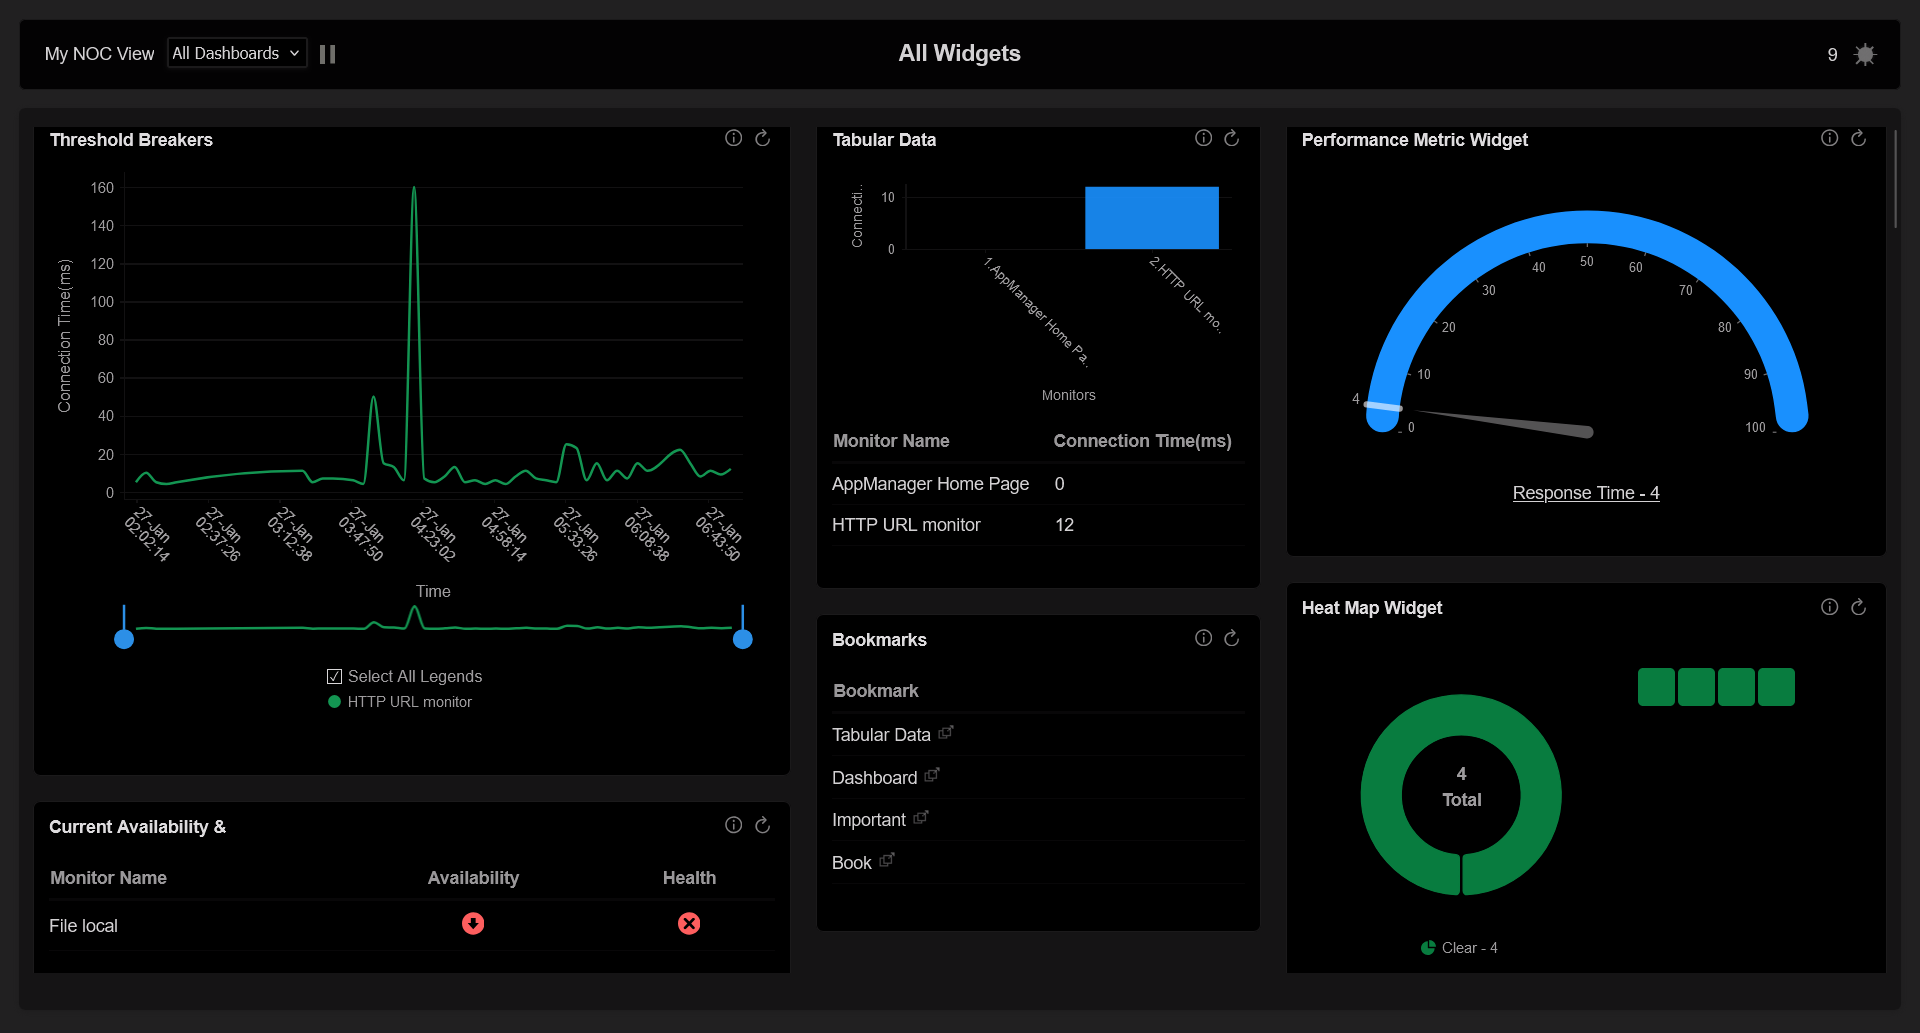
3. Revamped Applications Manager’s dashboard UI for effortless navigation
A well-structured dashboard eliminates friction, allowing teams to detect and resolve issues faster. The redesigned Applications Manager dashboard improves usability with:
-
A cleaner layout that places key metrics front and center, helping IT admins instantly spot and address critical performance deviations without unnecessary distractions.
-
Seamless consistency with the APM Insight Dashboard, ensuring a unified monitoring experience across different platforms for comprehensive visibility.
-
Dark and light modes, optimized for different working conditions, reduce eye strain and enhance visibility in Network Operations Centers (NOCs) and 24/7 monitoring.
With an optimized layout and improved navigation, you can access critical data faster, making it easier to detect anomalies and enhance operational efficiency.
4. SVG-based severity status icons for faster issue recognition
Clear, visually distinct alerts are crucial in high-pressure IT environments where every second matters. The introduction of SVG-based severity status icons ensures that you can immediately recognize the status of your system health.
-
Sharper, scalable icons eliminate confusion when distinguishing between healthy, warning, and critical states, making outage detection faster and more effective.
-
Optimized for both dark and light modes, these icons maintain high contrast, ensuring teams can instantly identify system status in any viewing condition.
-
Faster issue prioritization enables you to immediately respond to high-impact system failures, reducing downtime and preventing minor issues from escalating.
By enhancing alert visibility and reducing response time, the dashboard upgrades ensure faster incident resolution and a more proactive IT monitoring approach.
How these enhancements will transform IT monitoring
The updated Applications Manager’s dashboard brings smarter, more efficient IT monitoring enhancements. By integrating interactive charts, deeper data analysis tools, and a more user-friendly UI, you can:
-
Resolve performance issues faster with real-time visual insights.
-
Navigate dashboards effortlessly, focusing on critical metrics without distractions.
-
Make data-driven decisions efficiently, leading to better system reliability and uptime.
-
Streamline reporting, making performance insights more accessible for stakeholders.
Upgrade to the enhanced Applications Manager’s dashboard today
These improvements are available starting from version 174700, offering both existing users and new adopters a more efficient, insight-driven monitoring solution. If you haven’t yet explored Applications Manager, now is the perfect time to start with a free, 30-day trial and experience these enhancements firsthand.
The future of IT monitoring starts here
Modern IT environments demand intelligent, data-driven monitoring solutions. With these powerful dashboard enhancements, Applications Manager provides you with the tools you need to stay proactive, optimize performance, and respond to issues with greater speed and accuracy.
Start exploring these features today to improve your IT monitoring experience. Your feedback continues to drive innovation, ensuring Applications Manager evolves with your needs—now and in the future. Take control of your monitoring journey with Applications Manager!