There is a new trend in the database world that is fast becoming the toast of cloud computing – NoSQL technologies. Elastic scalability, increasing volumes of ‘Big Data’, flexible data models that are non-relational and non-structural, are a few reasons for the emergence and exponential growth of NoSQL database systems. Let us take a look at ‘MongoDB’ – a key player among NoSQL databases, and how Applications Manager can help monitor your MongoDB systems.
MongoDB is a pioneer among NoSQL databases. It is famous for features like dynamic schemas, BSON format of data storage, ad hoc queries, indexing, master-slave replication, load balancing through sharding, aggregation, etc.,
What does Applications Manager have to offer for MongoDB Monitoring?
1. Map View – Visualize the nodes in the replica set or shard servers
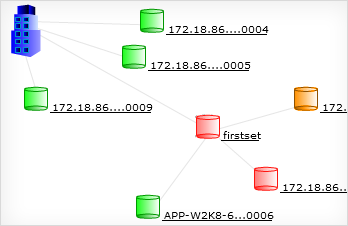 The real time deployment model of MongoDB servers may vary from just a single node, to a set of nodes in one replica set, to ‘one master – multiple slaves’ configuration, to multiple replica sets that are load balanced through a shard server, etc.,
In Applications Manager, there is an option to discover all nodes in the replica set / shard server during the discovery process itself. All nodes are grouped into their respective replica set and shown pictorially in a map view representation to depict the real time deployment model. This view can be found in the device monitor snapshot page. Thus, understanding the deployment model is made easy using Applications Manager.
2. Infrastructure View – Get details of the entire database system at a glance
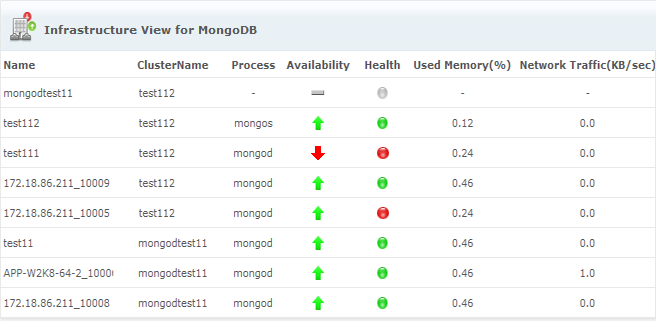
The Infrastructure View in the MongoDB monitors page details all the nodes in the replica set / shard servers.
It is a list view showing the device name, cluster to which it belongs, if it is a mongod / mongos process, availability status, health status, used memory in % and network traffic in kilobytes per second.
3. Visualize current load and plan capacity
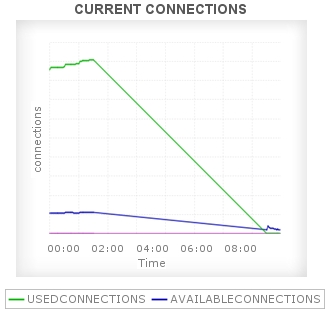 The term ‘Connections’, signifies the clients connection to the database server as well as inter node connections in the case of replica set or shard cluster.
Applications Manager collects connection stats like the number of connections to the database servers and the number of free / unused connections available in the database server. These statistics helps in assessing the current load and capacity requirements of the database server.
4. Operation Counters – Analyze load on the database server in a more granular manner
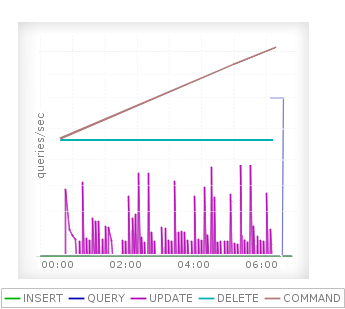 Operation counters are count of queries of different types since the database was last started. It helps in analyzing the load on the database server in a more granular manner. The queries include insert, select, update and delete queries. The commands is the total number of commands issued to the database server since the last start of the database server.
If the node is part of the replica set, then along with these counters, there are also replication operation counters like the number of replicated queries by type (insert, select, update and delete) and total number of replicated commands issued to the database. These counters help to analyze the load on the replica set in more granular manner.
If the node is a mongos shard cluster server, apart from the basic operation counters, there are also operation counters that gives the number of queries of different type in shard operations and not-shared operations. These extra counters helps in analyzing the load on the shard cluster server in a more granular manner.
5. Ensuring data consistency
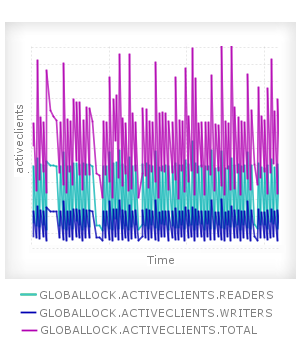 Data Consistency is very important in any database system. MongoDB ensures consistency by way of a locking mechanism where it uses ‘readers-writer’ lock that allows concurrent reads access to a database but gives exclusive access to a single write operation.
Applications Manager collects various attributes with respect to lock that helps in assessing the performance of the database server. These attributes include number of operations that are currently queued and waiting for the read-lock or write-lock, number of active client connections that are currently performing read / write operations, global lock held time in seconds, etc.,
6. Crash recovery made easy using journaling statistics
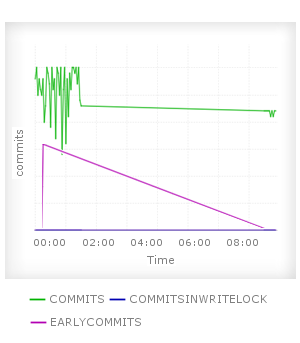 MongoDB uses the concept called journaling to guarantee write operations durability, data consistency and to provide crash recovery. The data is written to an on-disk journal before making the changes to the data files. Applications Manager collects these attributes to know about journaling performance.
Some of the attributes are related to number of commits, amount of data and various time factors involved.
Number of Commits attributes: This includes commits to journal in the last commit interval, commits behind the write lock and commits before the scheduled commit interval.
Amount of data attributes: This includes data written to the journals and data written from the journal to the data files in the last commit interval.
Time factor attributes: This includes time taken in collecting performance details of journaling, time for preparing to write to the journal, time actually spent in writing to the journal, time spent in writing to the data files after journaling and time spent in remapping copy-on-write memory mapped views.

Pingback: Monitoring Cassandra Cluster Databases with Applications Manager
Pingback: Monitoring Cassandra Cluster Databases with Applications Manager | ManageEngine Blogs