Generate Reports Using ManageEngine IT360
Report generation is the one of the important task of all management tasks. This allows the IT Administrator analyze the trend of every IT resource over time and evaluate its performance. This analysis is useful for making calculated predictions and help take corrective actions.
Generating reports in ManageEngine IT360 is one of the easiest tasks. You have a centralized location from where you can generate a number of different types of reports. You can generate trend analysis report, availability report for the entire business service or for a particular monitor (IT resource). For example, this also allows you to generate Trend Analysis Report which enables you to track various trends of response times of WebLogic Server, view active JDBC connections, JVM Heap Current Size etc. You can also generate reports for ERP system metrics such as SAP or Oracle E-business suite such as Page In/Page Out rate, Spool Utilization, number of Enqueue Requests etc.

To generate these reports in ManageEngine IT360, log in to IT360 console and click on the 'Reports' module tab. In this tab ManageEngine IT360 allows you to generate report for either the business services (applications & servers) or for the network devices which are being monitored.
ManageEngine IT360 also allows you to generate report for any specific monitor (IT resource) or any specific attribute for that monitor. For example, you can generate the Response time (in ms) for a WebLogic server. You can also generate availability report of an entire business service for any particular period during which it is monitored. You can also select a specific attribute within the business service and generate report.

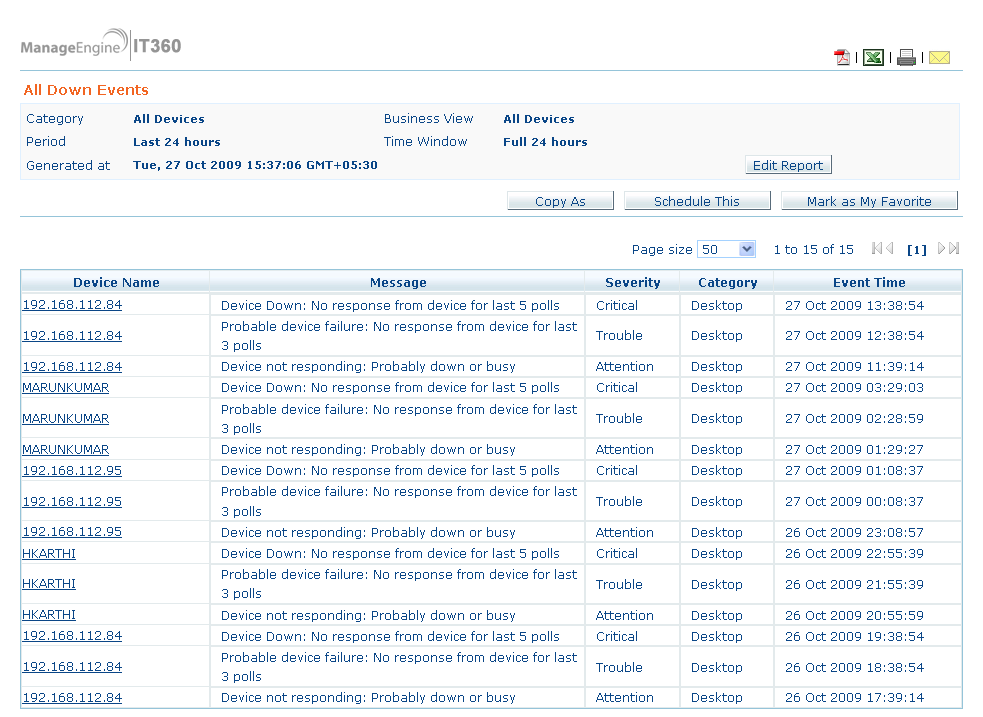
Similarly to generate reports for various network devices monitored using ManageEngine IT360, click on 'Network' tab. Here you will find a multitude of options to choose from. You can generate reports for various network events, downtimes, alerts etc.
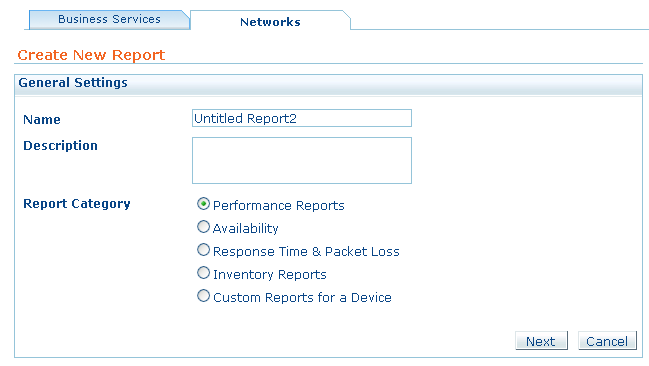
You can also create new reports types such as performance reports, availability reports, response time & packet loss reports, inventory reports and custom reports. Simply provide the name for the new report, select the type of report you need to generate for a device and select the device for which the report needs to be generated. IT360 will automatically select the various attributes available for the device and lets you choose the attributes for which the report is generated.
In the next post, we will discuss about how to schedule reports, enable reports and talk more in-depth about reporting.