
Network monitoring is a challenging job because networks continue to evolve to meet ever-changing client requirements. Businesses today heavily depend on their networks, and even a short outage can lead to penalties and lost profits. This is why your monitoring tool must also transform itself to not only scale as you grow but offer new features that address new challenges posed by the increasing usage demands placed on your network.
Let's take a brief look at the recently released features in OpManager to showcase how our product has evolved over time to match the dynamic requirements of IT monitoring.
If you are already using OpManager, we encourage you to utilize these features and leverage network monitoring.
Root cause analysis
Network issues such as sluggish performance or an outage are inevitable and common for any network. But the key lies in how quickly your network bounces back to normalcy. Mean time to repair (MTTR) is an important metric that helps you measure the actual time it takes to identify, analyze, and fix the issue.
Maintaining low MTTR values is important to avoid SLA breaches and penalties. But keeping tabs on MTTR values is easier said than done.
Networks are complex systems with hundreds (if not thousands) of humans working in them, and minor human errors such as improper device configuration can bring important services in your network to a screeching halt.
When downtime hits or a performance issue is noticed, the first thing you need to do is identify the root cause as soon as possible and resolve it. But, root cause analysis (RCA) often takes more time than the time needed to resolve the issue.
This is exactly what
OpManager's RCA feature helps you address. It enables you to visualize the monitoring data of your network (including your devices, interfaces, and URLs) in one view. This centralized visibility enables you to analyze, compare, and correlate issues, and narrow down the root cause quickly.

Network path analysis
Routing is crucial for networks, and when there is a problem in it such as route hijacking, the packets that are in transit may drop on the way and result in an outage or a performance slump. This could lead to service disruption and leave customers unhappy.
Network path analysis in OpManager helps you visualize the entire path between the source and destination. It shows the hop-by-hop performance of the various paths in your network and enables you to pinpoint where exactly the issue is. For example, the issue could be with your ISP or a connecting router in your LAN.

You can also identify issues proactively and track why transit delays occur. By configuring threshold values for metrics such as packet loss and latency, you can get notified whenever ideal levels are breached.
Adaptive thresholds
Following a proactive approach in monitoring helps you in two ways:
- Avoid issues cascading into an outage.
- Reduce the number of end-user complaints.
If you are an existing user, you know how the
threshold violation configuration option helps you identify impending problems that can seriously plague your network.
Manually configuring thresholds for critical devices is fine, but the usage of each device will vary based on the demands placed on it. For example, for certain mission-critical servers, average CPU utilization will be 85-90% while for other non-critical servers, CPU utilization may be around 60%.
If you set the common threshold value for all these servers at, say 80%, you'll get constant alerts, but mostly for the mission-critical servers. However, you know that the ideal utilization percentage of mission-critical and non-mission critical servers differs, so it is important to set threshold values based on usage, because it will help you more accurately identify abnormalities, if any.
The
Adaptive Threshold feature in OpManager dynamically alters the value of the thresholds based on previous trends. It uses the power of machine learning to study the usage trends of each device (based on various monitors) and then generates a highly reliable forecast value.
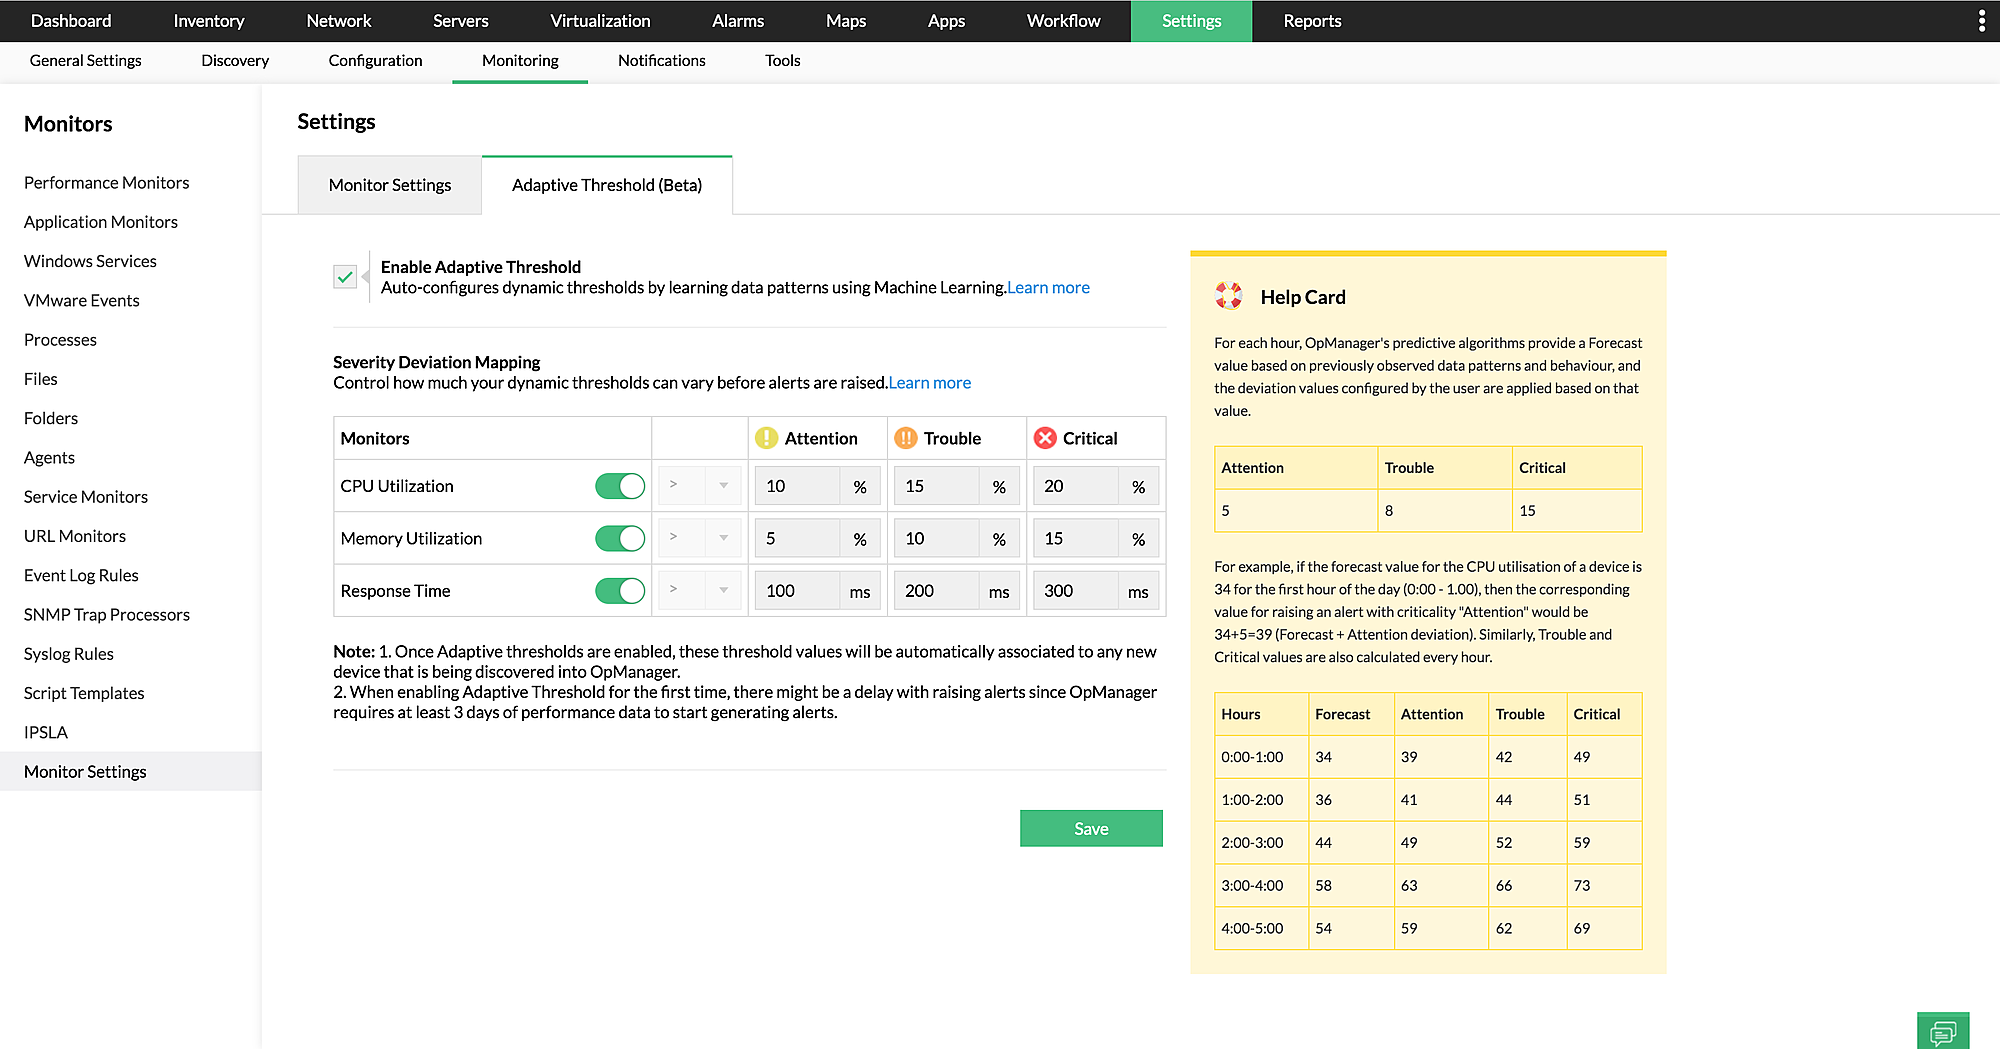
As an IT admin, your job will be to set the deviation value, so when the actual utilization crosses the total of the forecast and deviation value, an alert will be generated.
Forecast + deviation value = threshold valueThis will be highly useful in detecting abnormal spikes during non-work hours. Based on past usage trends, OpManager will learn that the average usage on weekdays is higher than that on weekends and set threshold values based on this historical data.
For example, during weekdays the threshold value to trigger an Attention alert will be set to 90%, so when CPU utilization reaches 85%, it will be considered normal and no alert will be generated.
However, for the same metric, the threshold value will be set to 60% during weekends, as the CPUs are required to run only some important services. So if there's a sudden spike in CPU usage during the weekend, an alert will be raised to notify about the issue.
Security enhancement features
Network security is integral for business growth; any security breach could have long-lasting effects and serious consequences, destroying a company's reputation and resulting in huge revenue loss.
The following two features help you exercise better control over the user access privileges with a stronger authentication mechanism.
SHA-2 authentication in SNMPv3
Since the inception of SNMPv1, there have been constant improvements to enhance security, resulting in the evolved versions: SNMPv2 and then SNMPv3.
SNMPv3 was considered the best in terms of security because of its authentication and encryption features. With the authentication layer, it verifies whether the data packets are received from a valid source and then encrypts the data it sends to prevent untrusted sources from reading the data.
However, the authentication algorithms—MD5 and SHA-1—used in SNMPv3 were found vulnerable over time.
Hashing and securitySHA-1 returns a 160-bit hashed value for the given input. Generally, the greater the length of the hash value returned, the better the security. In this context, its successor, SHA-2, which comes in two versions—SHA-256 and SHA-512—is capable of returning 256 and 512 bits based on the version used, and therefore offers better security.
SHA-2 can also produce 2^256 and 2^512 different hashed values, avoiding collision when the same hash value is repeated—an issue with SHA-1, which generates 2^160 different values.
Moreover, since 2017, major tech companies like Microsoft, Google, Apple, and Mozilla have stopped accepting SHA-1 SSL certificates, as they were found vulnerable to attacks.
OpManager has pioneered in extending support to the
SHA-2 authentication algorithm for SNMPv3-based monitoring to enable a secure monitoring experience.
SAML authentication
User management is a key aspect when monitoring networks. When you do not have any control or visibility over who is accessing what in your network, it can create an easy way for intruders to gain access to sensitive data in your network.
The Security Assertion Markup Language (SAML) is a powerful authentication algorithm that helps you verify the authenticity of a user before allowing the user to log in to OpManager.
Working principleThere are two components involved in
SAML authentication: Service provider (SP) and identity provider (IdP). The SP is any application that provides service to an end user; in this case, it is OpManager.
The IdP is an entity that holds user credentials such as usernames, passwords, and SSH keys.
Every time a user logs in to OpManager (the SP), the credentials of the user are sent to the IdP, which in turn checks the authenticity and then grants permission to log in. If the user turns out to be an intruder, then the permission is restricted.
This helps you to kick security up a notch and track malicious login attempts made in your network.
OpManager is a feature-rich network monitoring tool offering all the above mentioned features, but our team doesn't stop here. We actively follow the market, engage with customers, gain an understanding of customers' needs from various sectors, and tailor our product features to suit those needs.
Take a look at our
product features roadmap. Or
share your ideas for a new feature if you want to see a particular monitoring feature implemented in the future.