Less is more: Role-based performance monitoring with OpManager
Much of a business' strength lies in its network infrastructure. One way to keep your business up and running is by proactively monitoring key network performance indicators. However, with a plethora of parameters to keep an eye on, and a lot of data to skim through, there's only so much an IT professional can do while troubleshooting. This is a common challenge many IT teams in the network infrastructure monitoring field face, and it often increases the time taken to resolve issues.
One way to approach this challenge is by using a customizable, network performance monitoring console that only tracks the parameters you deem necessary. That's why OpManager is introducing role-based dashboards, which only show you what you need to know. The simple drag-and-drop interface, along with dozens of widgets as shown below, make it easier to use the right visuals, KPIs, and filters for monitoring.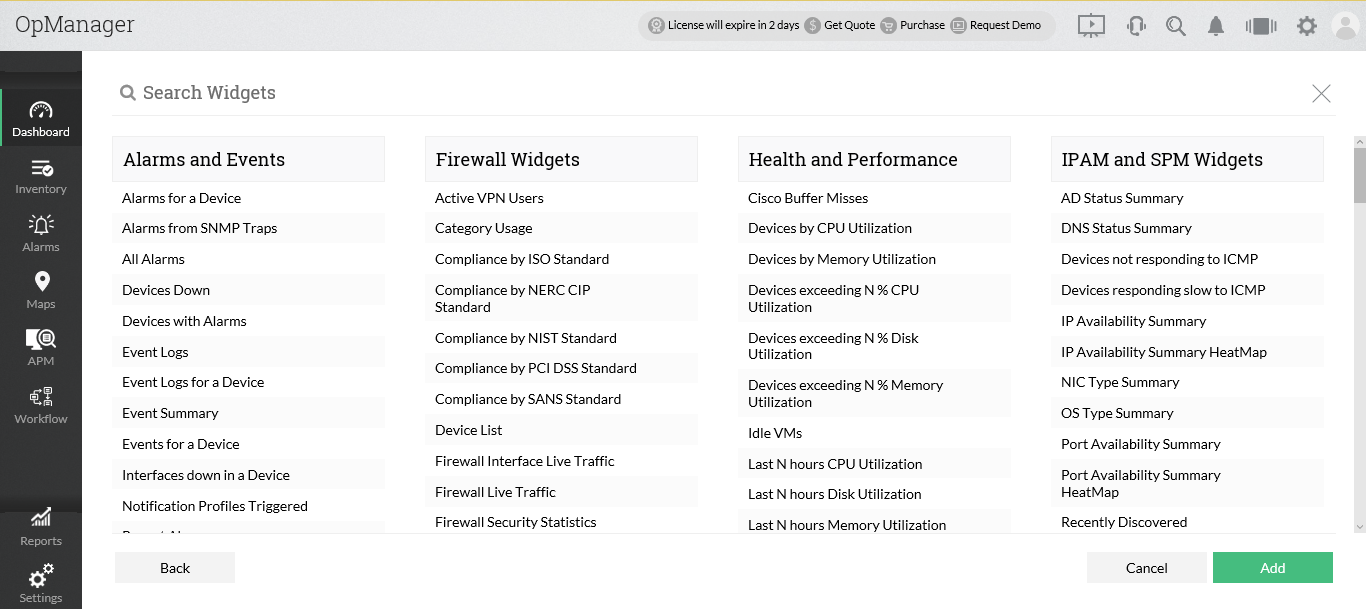 Some of the common network infrastructure management roles in an IT organization include: network technician/network scaling technician, network administrator/network manager, network analyst, network engineer, network solutions architect/network architect, wireless infrastructure administrator, VoIP engineer, data center administrator, server administrator, network operator, and IT operations manager. The best part of role-based dashboards is that all of these different staff members can make their own OpManager dashboard custom to their specific needs.
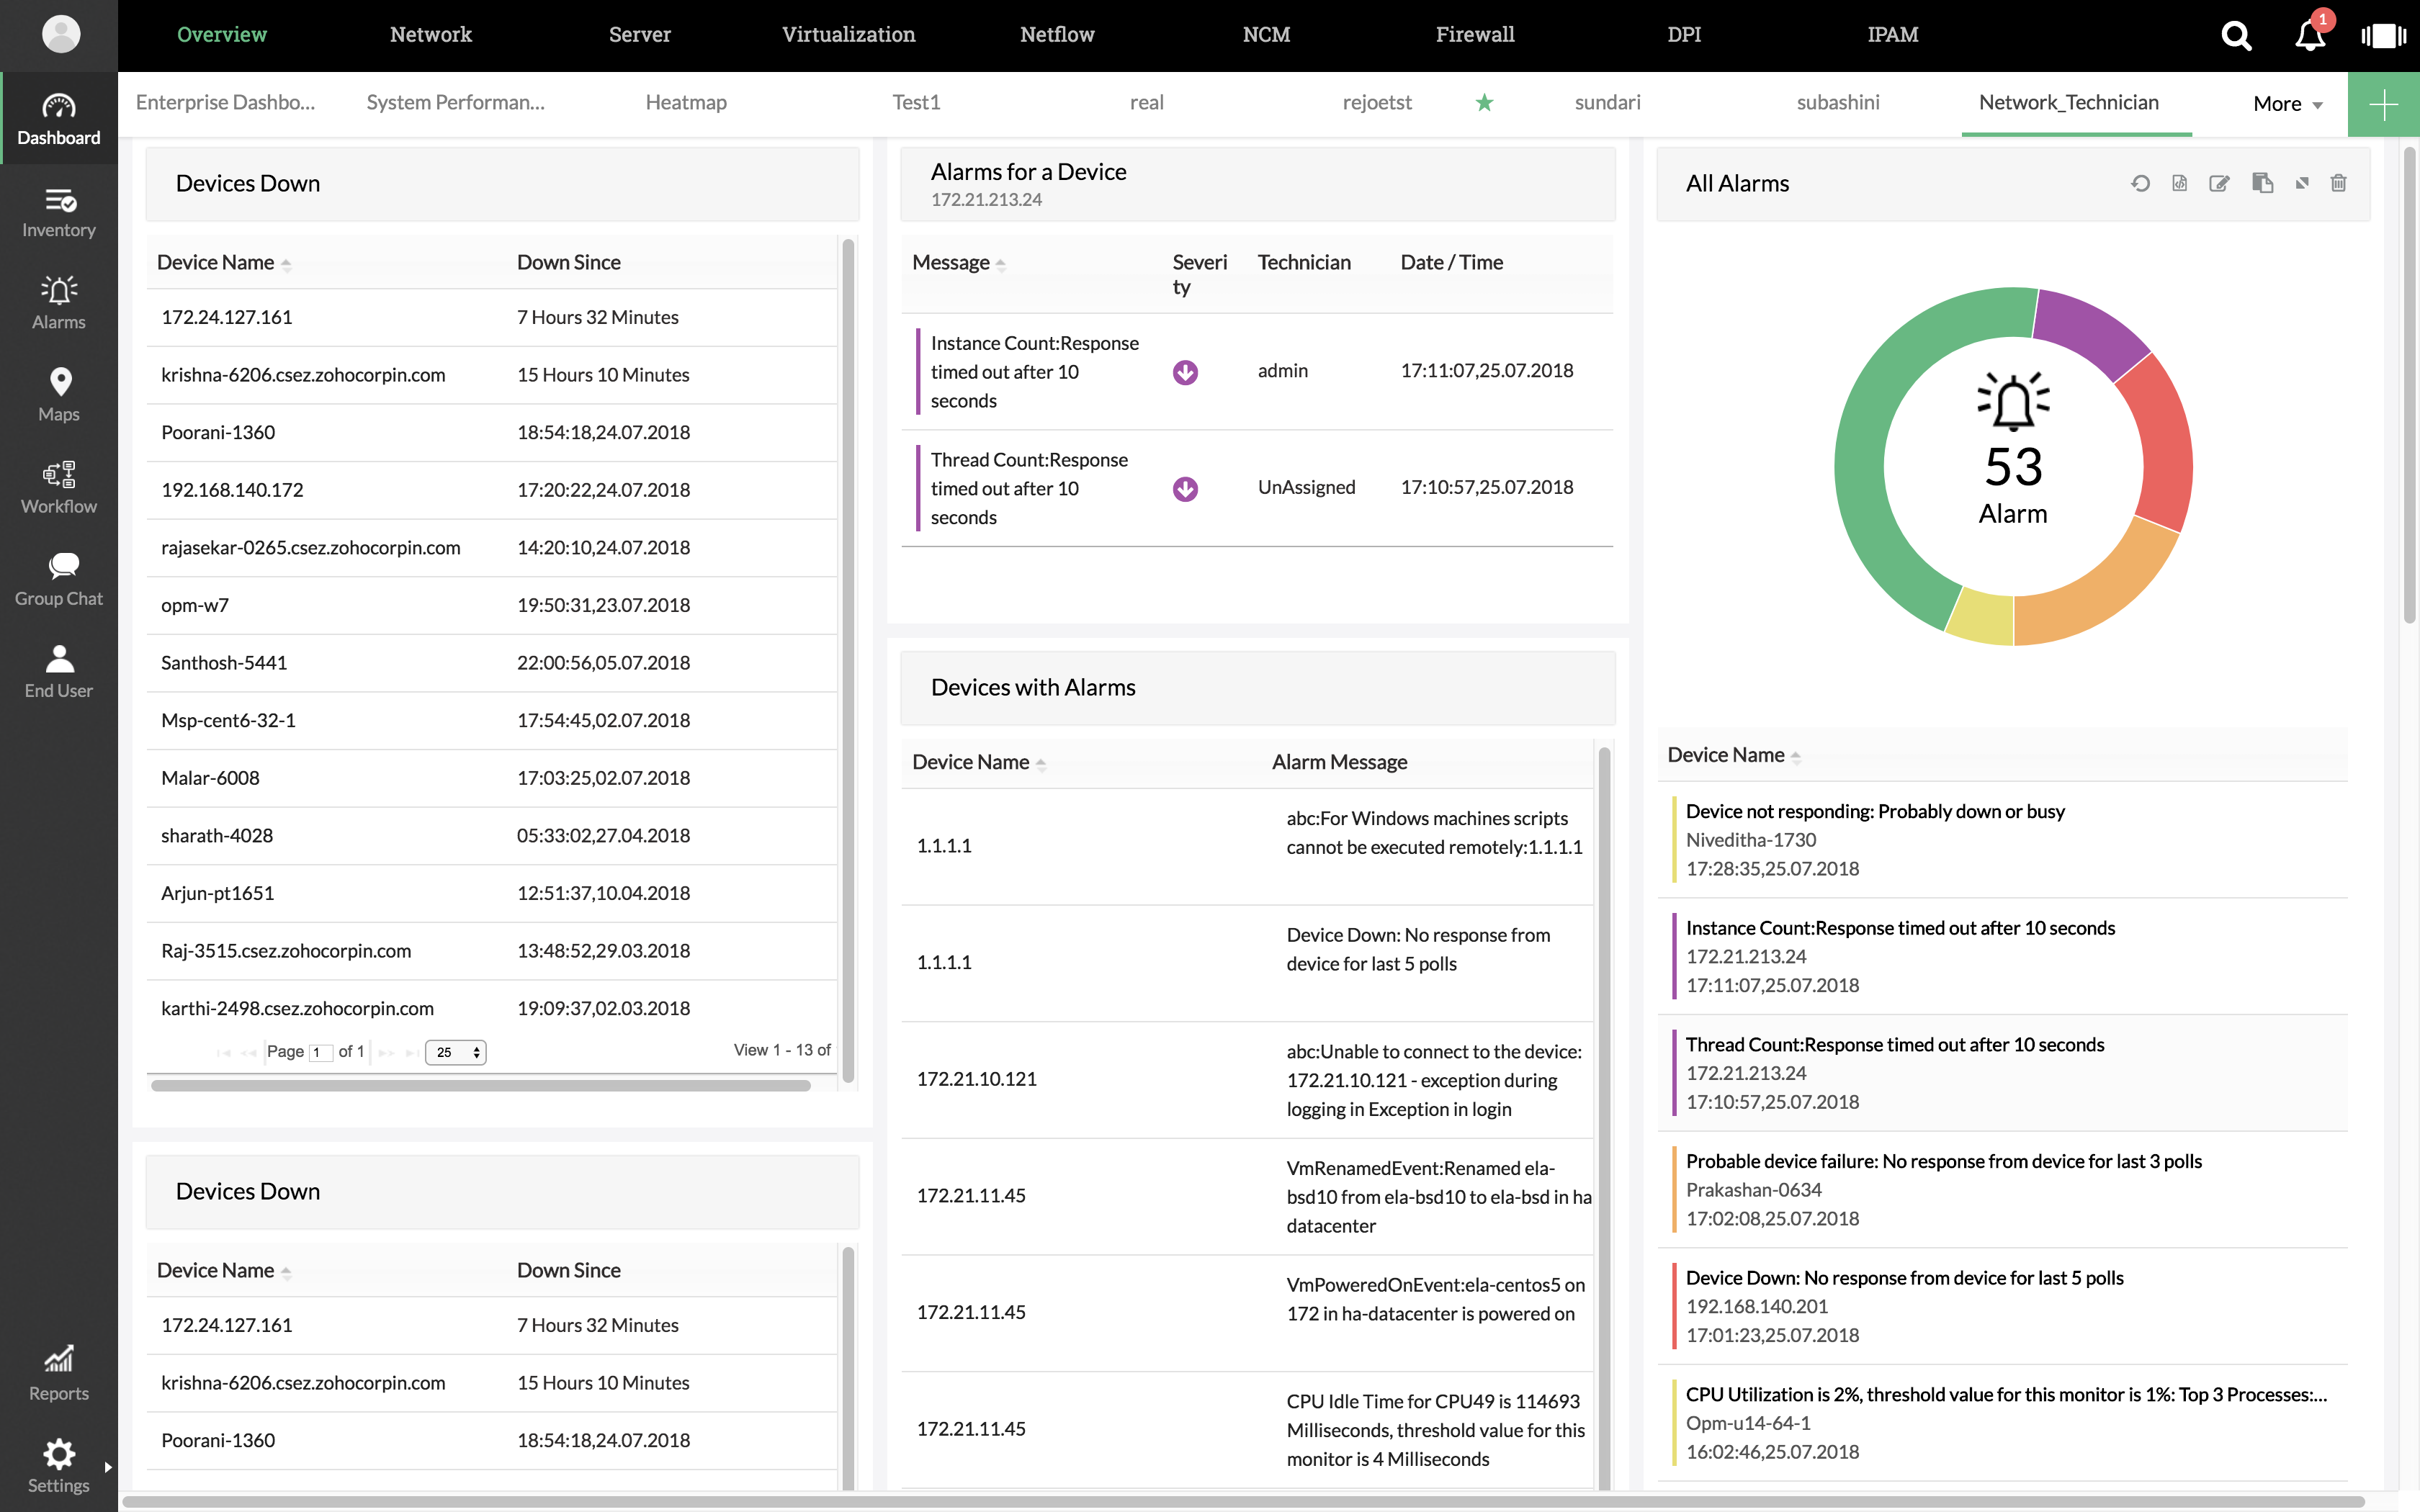 Network technicians need to be nimble enough to troubleshoot interfaces and system failures. With OpManager, technicians can view a custom dashboard containing real-time information about device availability, under-performing devices, and assigned alarms. This reduces the mean time to repair (MTTR), improving network health.
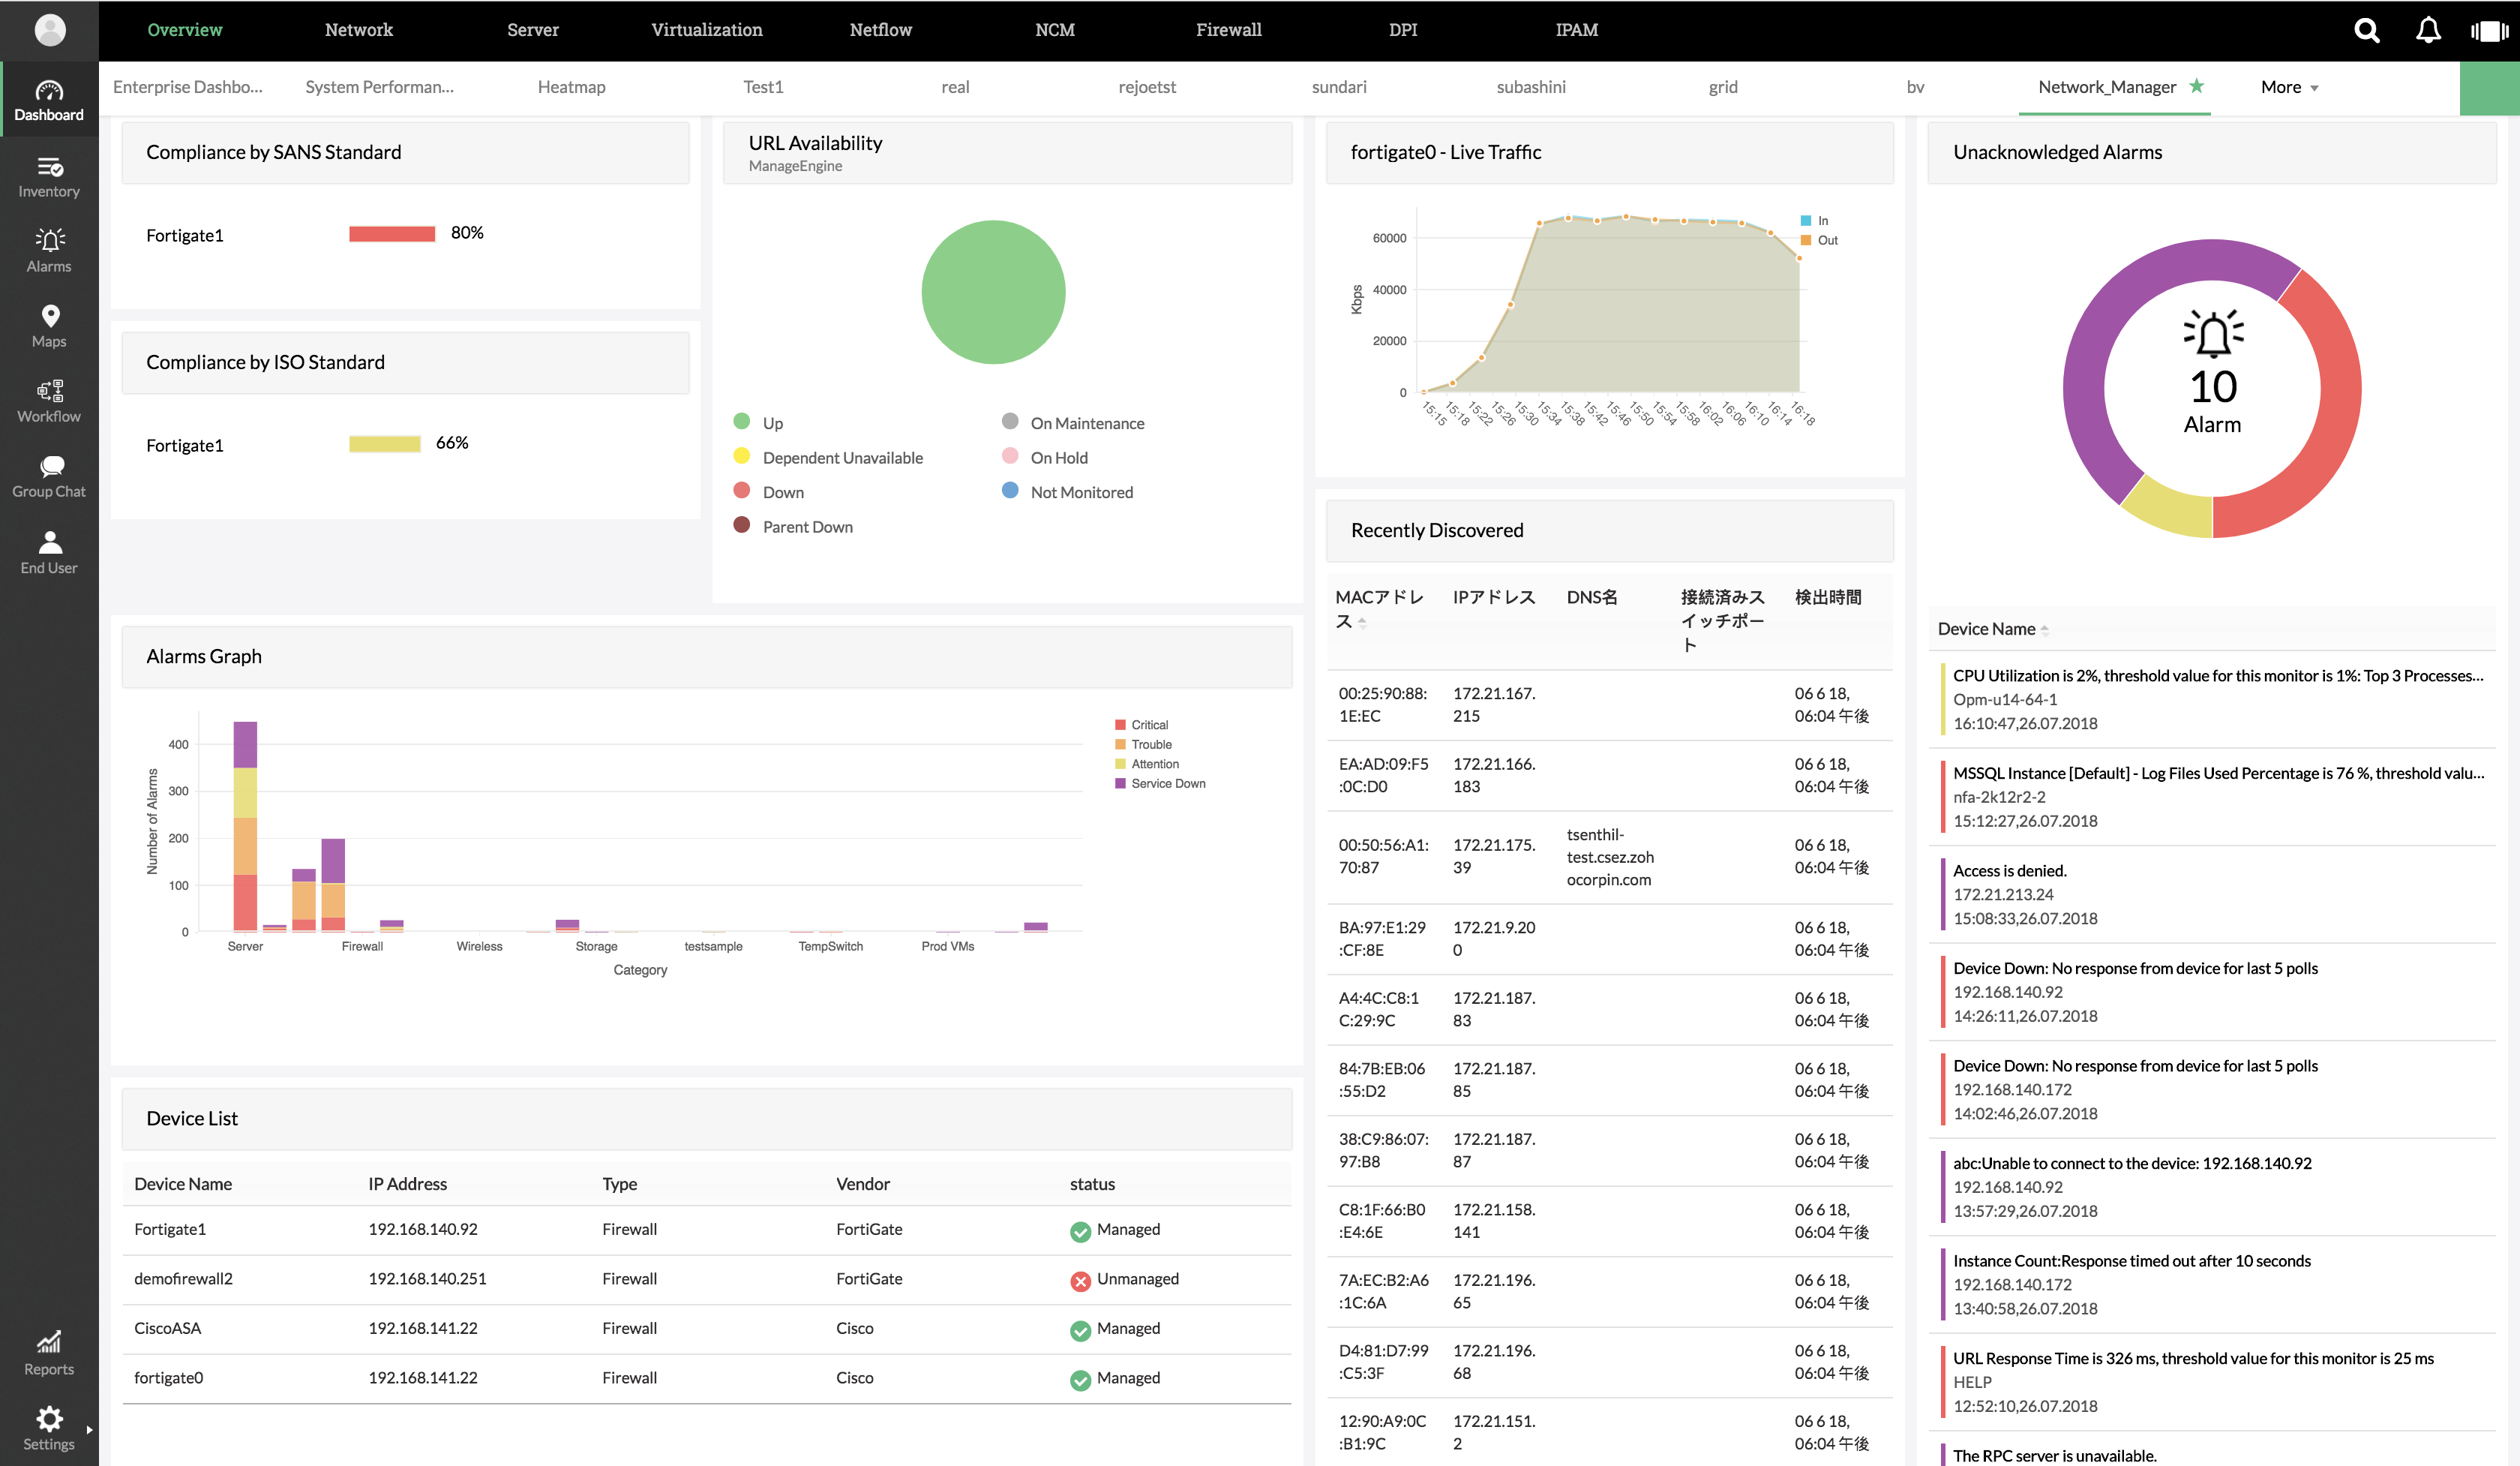 Network administrators or network managers need to have a straightforward overview of network flowcharts, data processing paths, and configuration parameters. Any network administrator or manager needs to be notified if the network technician fails to check and clear alarms.
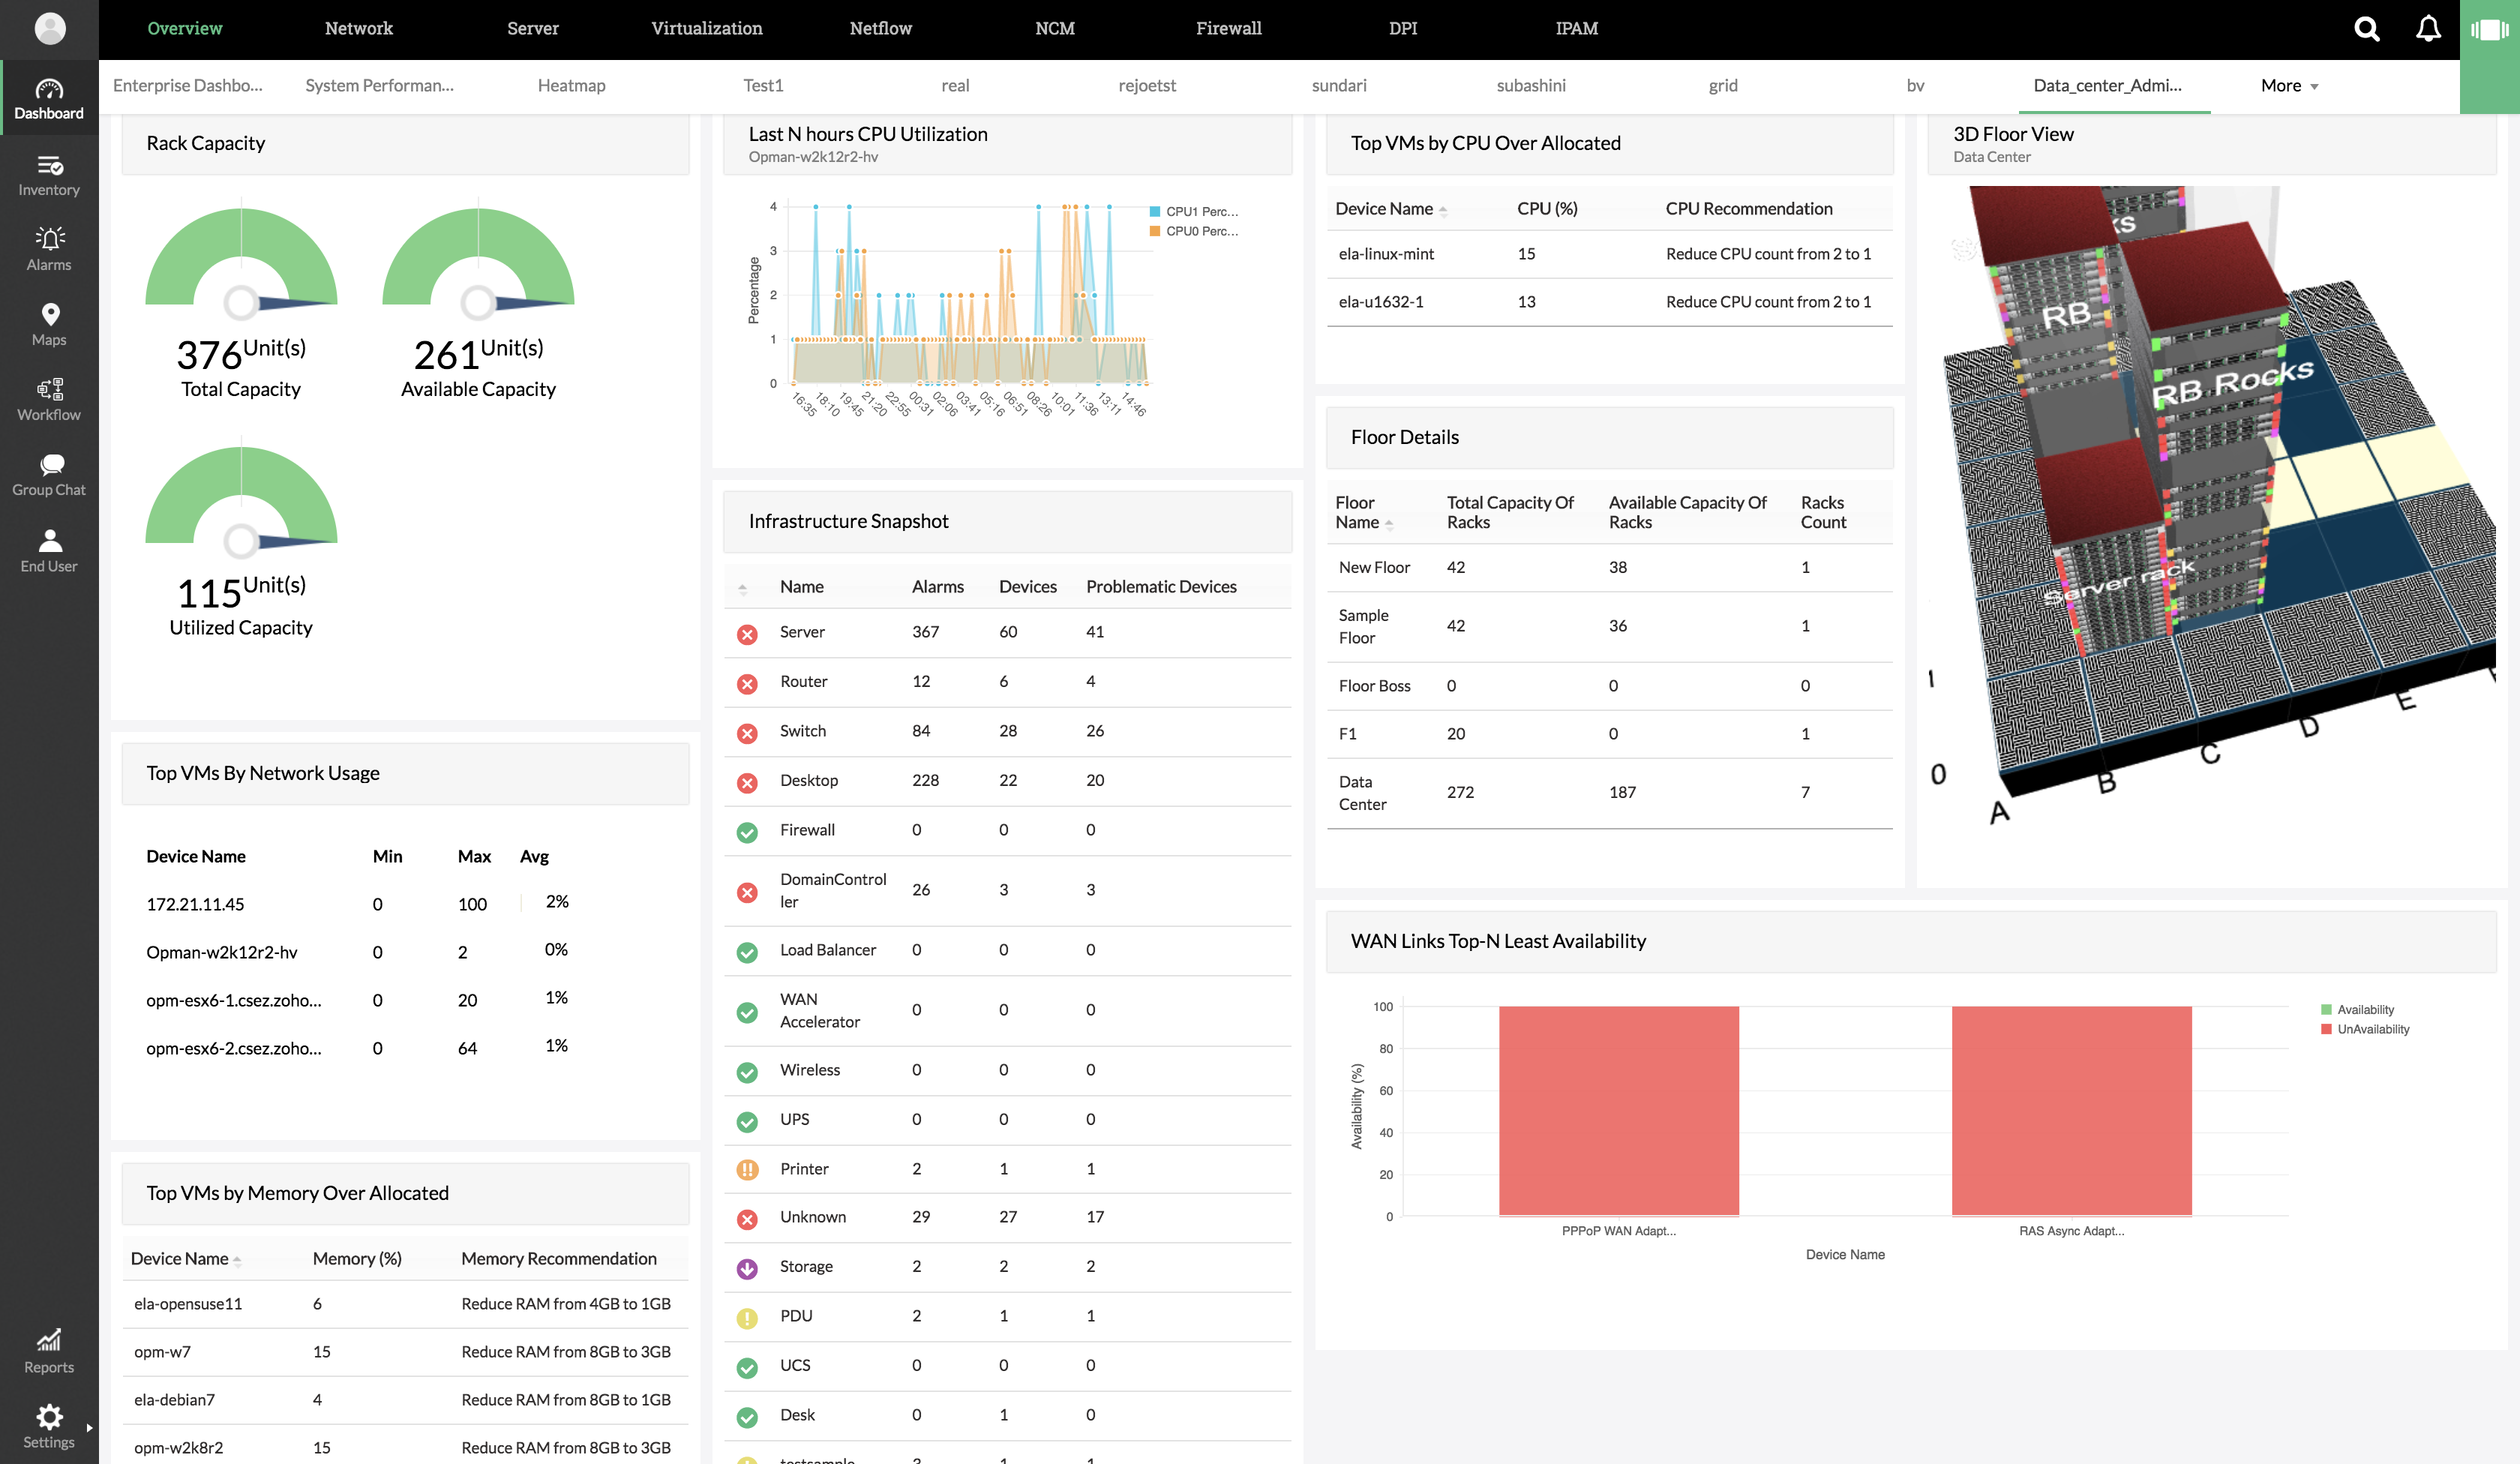 Data center administrators oversee the maintenance of equipment at the data center. These administrators can identify network paths with high round-trip times and figure out where an outage took place by viewing the hop-wise latency graph. They can use OpManager to diagnose thermal surges as well as manage capacity and inventory.
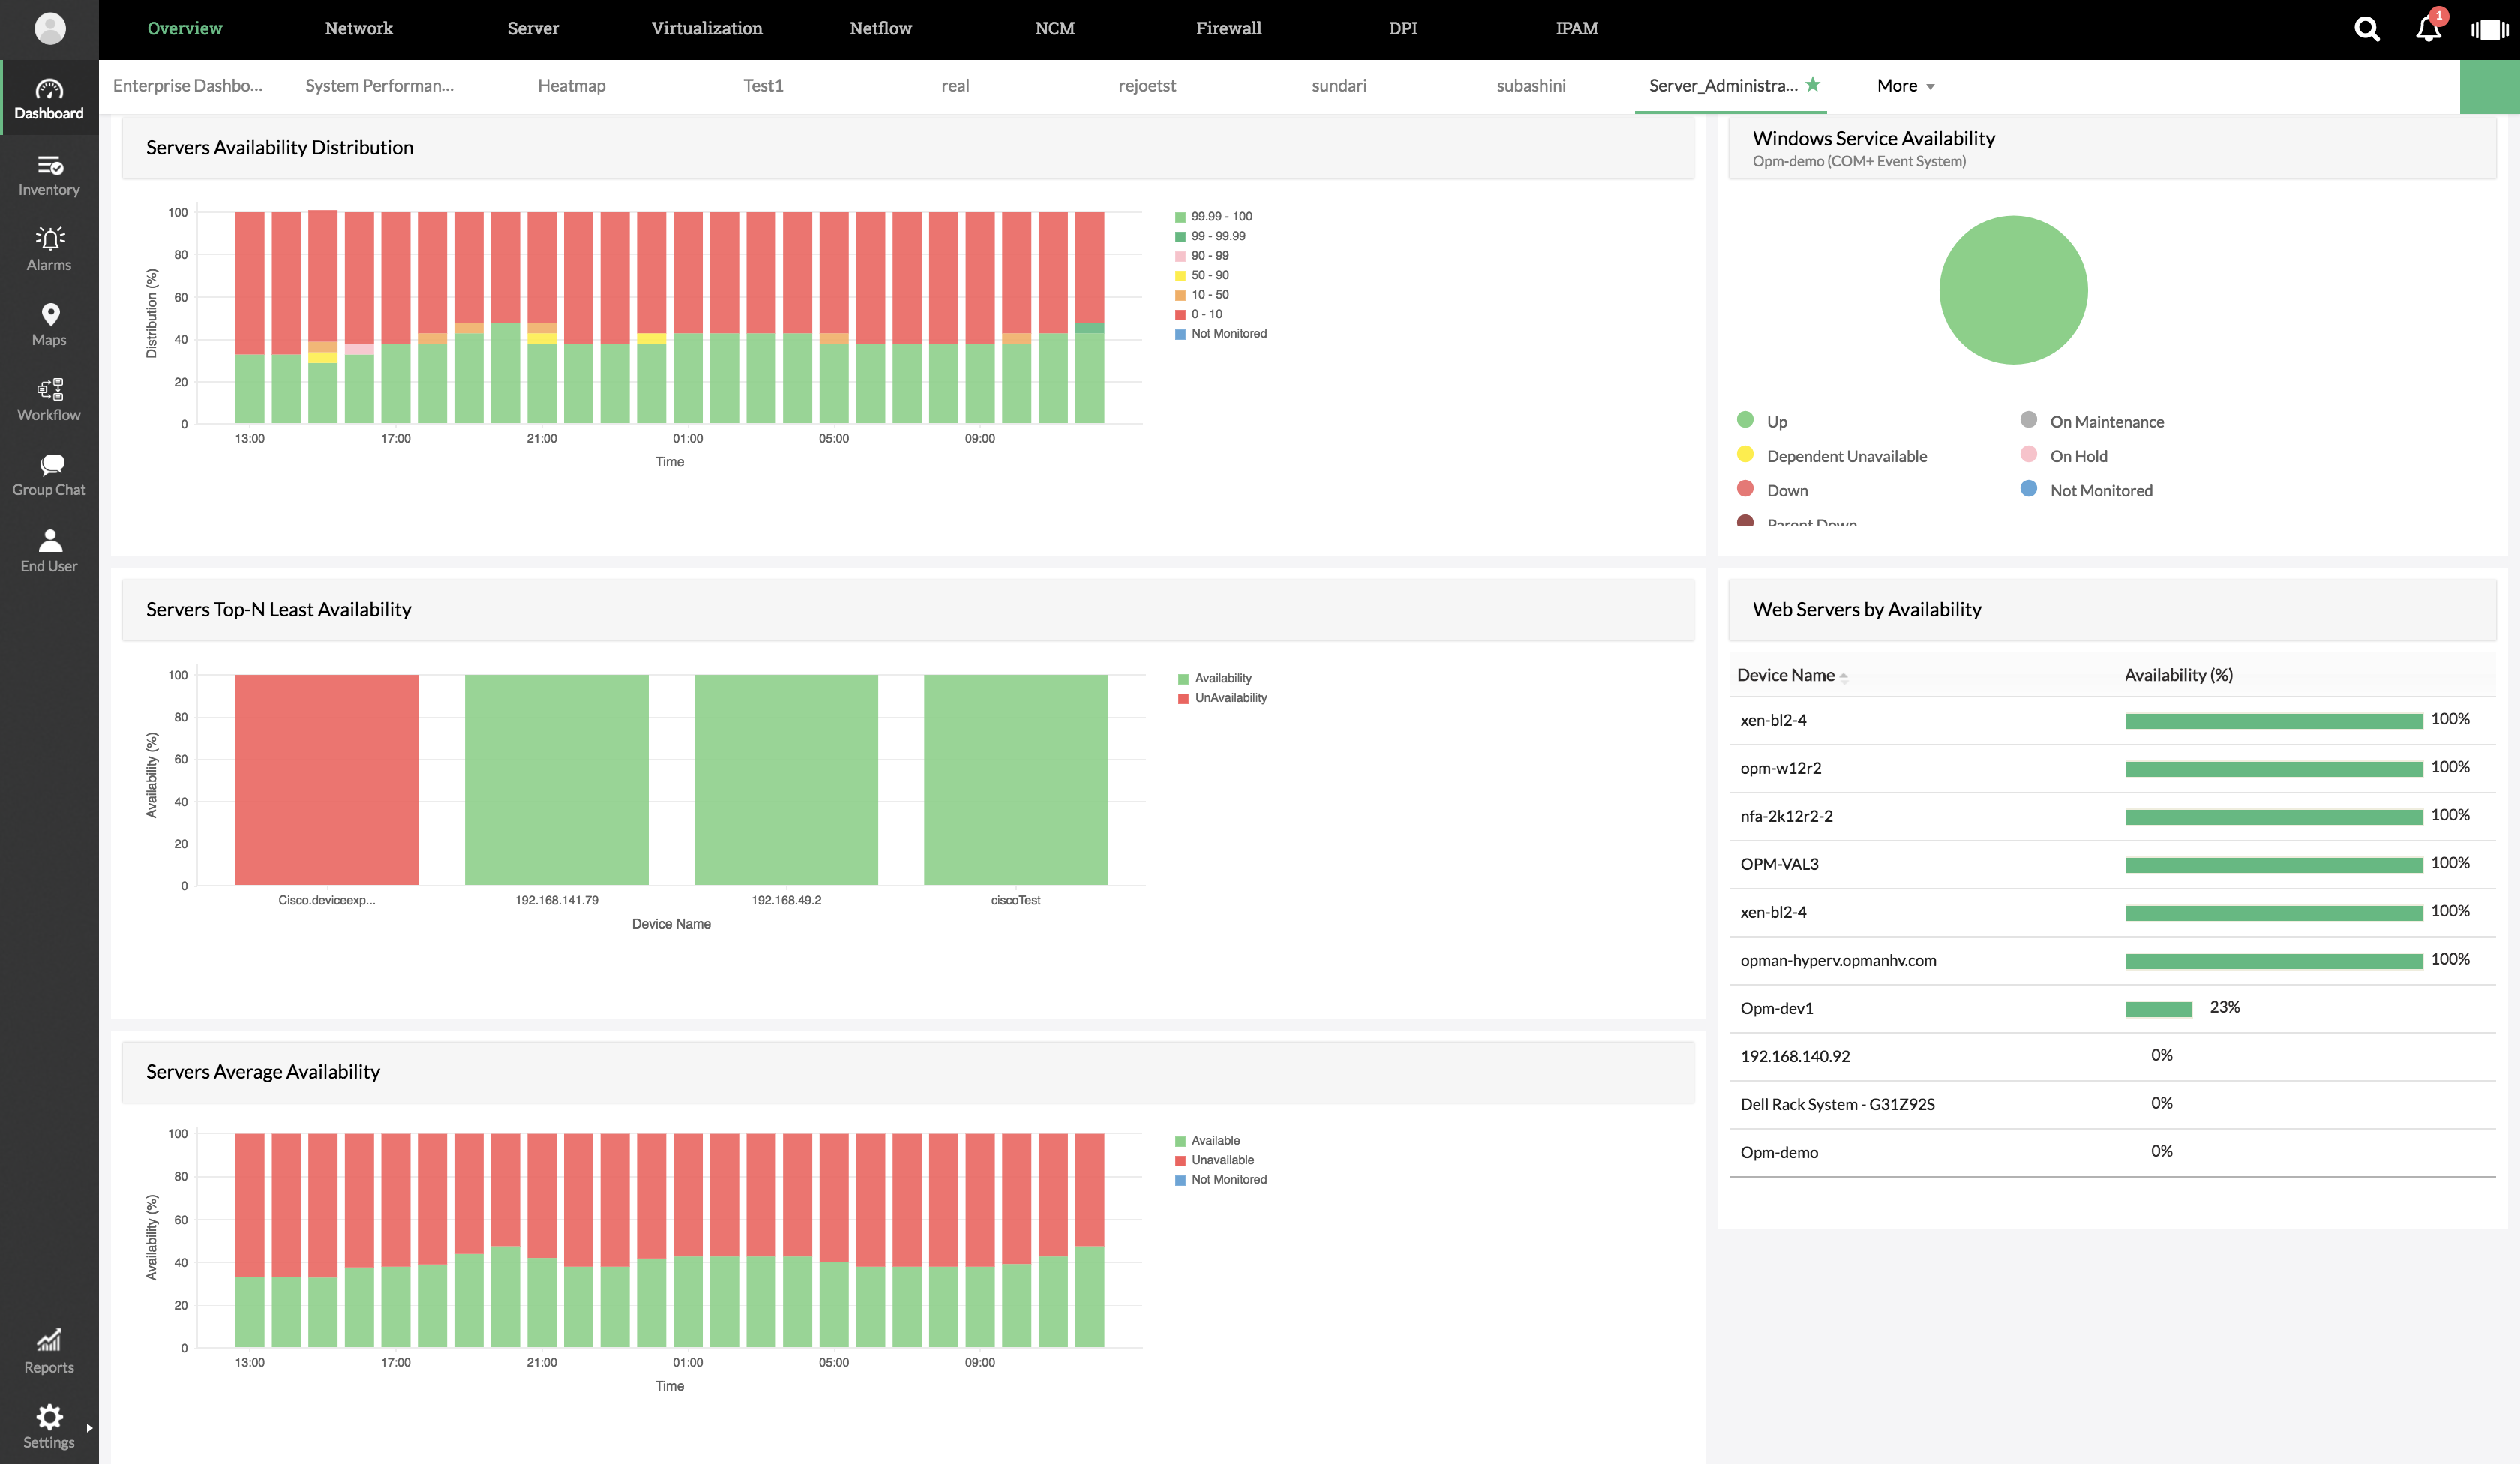 Server administrators track server availability, traffic, and downtime. Server activity, utilization, and distribution are major aspects to keep an eye on, and OpManager can monitor all these parameters.Advantages of using OpManager's custom dashboard feature:
Some of the common network infrastructure management roles in an IT organization include: network technician/network scaling technician, network administrator/network manager, network analyst, network engineer, network solutions architect/network architect, wireless infrastructure administrator, VoIP engineer, data center administrator, server administrator, network operator, and IT operations manager. The best part of role-based dashboards is that all of these different staff members can make their own OpManager dashboard custom to their specific needs.Network technicians need to be nimble enough to troubleshoot interfaces and system failures. With OpManager, technicians can view a custom dashboard containing real-time information about device availability, under-performing devices, and assigned alarms. This reduces the mean time to repair (MTTR), improving network health.Network administrators or network managers need to have a straightforward overview of network flowcharts, data processing paths, and configuration parameters. Any network administrator or manager needs to be notified if the network technician fails to check and clear alarms.Data center administrators oversee the maintenance of equipment at the data center. These administrators can identify network paths with high round-trip times and figure out where an outage took place by viewing the hop-wise latency graph. They can use OpManager to diagnose thermal surges as well as manage capacity and inventory.Server administrators track server availability, traffic, and downtime. Server activity, utilization, and distribution are major aspects to keep an eye on, and OpManager can monitor all these parameters.Advantages of using OpManager's custom dashboard feature:- Gain insight about your network's status from scheduled and real-time reports. With these reports, network faults can be detected or even predicted, enabling effective damage control.
- Instantly view useful information in the form of graphs on the dashboard instead of scrolling through pages of data.
- Analyze data patterns from different role perspectives to more easily categorize data.
- Optimize your screen space and filter data with over a hundred and fifty widgets to choose from.
- View data in real time to eliminate blind spots created by manually refreshing at different intervals.
- Abolish information overload.
- Tackle your daily monitoring tasks with a minimalist approach; de-cluttering your dashboard also de-clutters your work.