Monitoring disk I/O performance for application slowness
We get frequent queries from our customers on their applications being slow and ways to monitor this. Monitoring basic CPU, memory, and disk utilization gives a fair indication of where the problem could be, but you need to monitor more than just the resource utilization to actually determine the reason for application slowness. Multiple system resource parameters, or even a single parameter, can impact the performance of an application. Let's look at disk I/O—one of the key parameters that causes application performance-related problems.
Why monitor disk I/O?
The hard disk is one of the slowest components on a server. The hard disk drive bandwidth is around 300 times slower than that of the memory, and added to that, memory latency is very low—if you do the math, memory performs around 2,000 times faster than that of the hard disk drive. Check out http://nathanaeljones.com/153/performance-killer-disk-io/ for a neat explanation.
So monitoring and keeping the disk I/O at healthy levels can prevent a lot of application performance hiccups.
Does my server have disk I/O problems?
Depending on your server, there are different ways of finding disk I/O. Refer to http://www.performancewiki.com/diskio-tuning.html for the disk I/O commands on various servers.
Another simple way to find disk I/O—and what we recommend—is to use OpManager. OpManager monitors disk I/O out of the box for Windows servers (see screenshot below) and, with a few customizations, for Unix-based devices.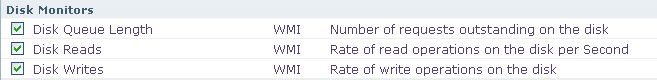 Before I sign off, thanks to Brien M. Posey at SearchDataCenter for selecting OpManager for enterprise-class server monitoring in his latest write-up, "Selecting benchmarking tools for specific needs."
For more on OpManager's related features, refer to this page on server monitoring with OpManager.
--
Pravin
The OpManager teamLearn more about ManageEngine's network monitoring software.
Before I sign off, thanks to Brien M. Posey at SearchDataCenter for selecting OpManager for enterprise-class server monitoring in his latest write-up, "Selecting benchmarking tools for specific needs."
For more on OpManager's related features, refer to this page on server monitoring with OpManager.
--
Pravin
The OpManager teamLearn more about ManageEngine's network monitoring software.
Why monitor disk I/O?
The hard disk is one of the slowest components on a server. The hard disk drive bandwidth is around 300 times slower than that of the memory, and added to that, memory latency is very low—if you do the math, memory performs around 2,000 times faster than that of the hard disk drive. Check out http://nathanaeljones.com/153/performance-killer-disk-io/ for a neat explanation.
So monitoring and keeping the disk I/O at healthy levels can prevent a lot of application performance hiccups.
Does my server have disk I/O problems?
Depending on your server, there are different ways of finding disk I/O. Refer to http://www.performancewiki.com/diskio-tuning.html for the disk I/O commands on various servers.
Another simple way to find disk I/O—and what we recommend—is to use OpManager. OpManager monitors disk I/O out of the box for Windows servers (see screenshot below) and, with a few customizations, for Unix-based devices.
Before I sign off, thanks to Brien M. Posey at SearchDataCenter for selecting OpManager for enterprise-class server monitoring in his latest write-up, "Selecting benchmarking tools for specific needs."
For more on OpManager's related features, refer to this page on server monitoring with OpManager.
--
Pravin
The OpManager teamLearn more about ManageEngine's network monitoring software.
How do I get Disk I/O historical statistics in Opmanager for Solaris, Aix, HPUX, Linux? I couldn't find in default options
Hi Abdul. Please contact our support team for assistance. You can reach them at opmanager-support@manageengine.com.