Network fault management with custom dashboards and CCTV views
When one tries picturizing a NOC, the big screen monitors immediately come to mind. Today’s post is about those big screens and how they can be made more useful with OpManager.
About NOC screens:
Wall mounted LCD/ Plasma screens are typically used by different IT teams for various network monitoring, fault management, and helpdesk purposes. The screen's visuals are rotated every few minutes at a pre-configured interval. For example, a view of
Here's how OpManager can help make best use of your NOC monitor screens:
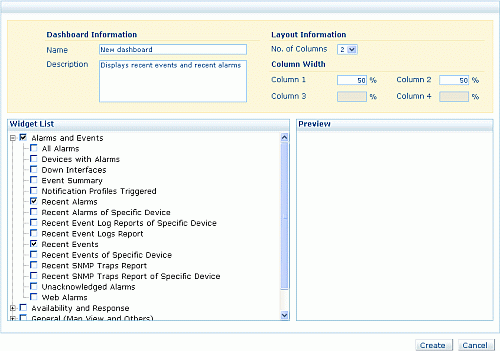
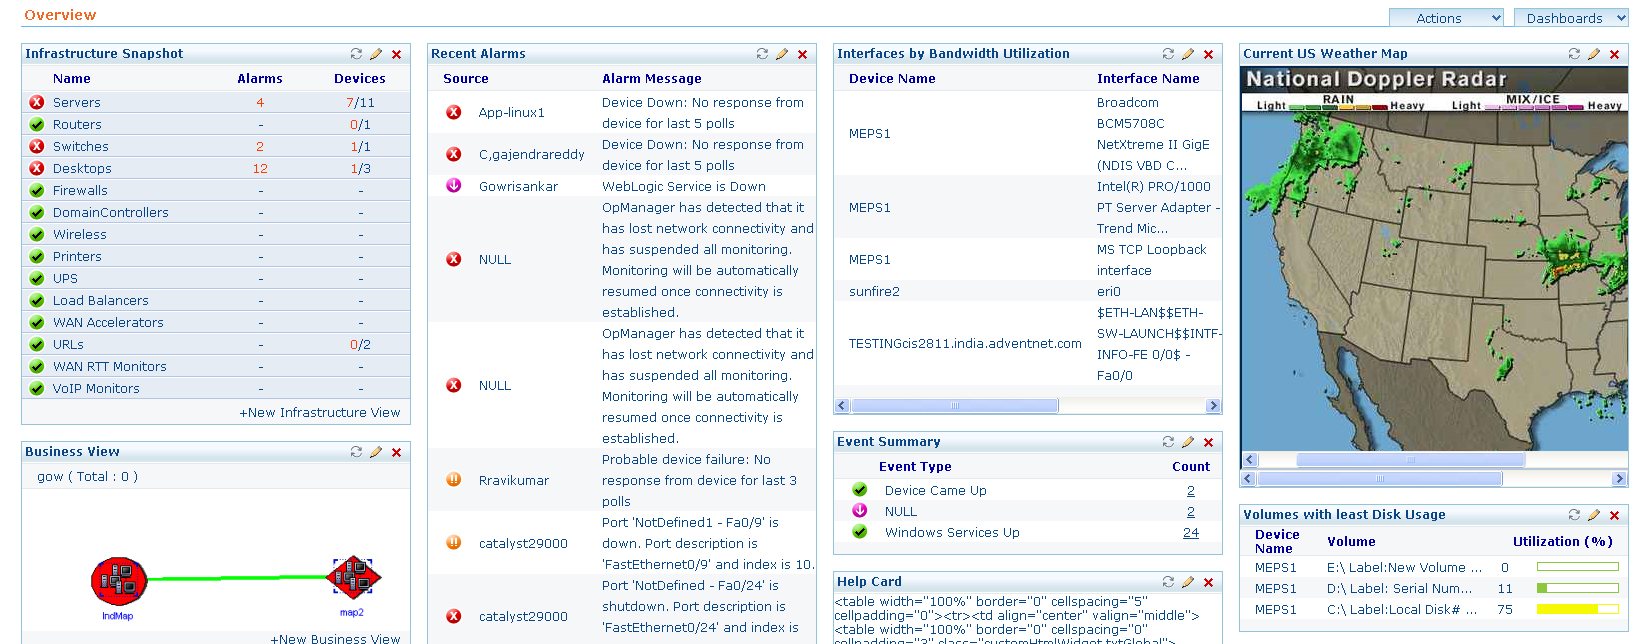
To begin with, one can customize the IT dashboard to display required network performance information using the 90+ out-of-the-box widgets. The widgets always get the most recent polled information. One can then create multiple dashboards e.g. an exclusive availability and performance dashboard for the network devices, a separate one for the datacenter and server etc.
Obviously the big screens have an expanse of usable real-estate. One can increase the number of columns on each dashboard and decide on how much space each column should occupy.

After creating a couple of dashboards, you can group these dashboards in a CCTV View with a custom-configured refresh interval. You can also have multiple CCTV views. You can then click on these CCTV views to pop them out in a new browser window to place them on to another big screen.
One can also get another web application or other web feeds within OpManager’s dashboard using the “Custom HTML or Text” widget.

By the way, these features are available in all the stand-alone OpManager editions and requires no extra module or web-servers. Try out these nice dashboards and have a blast in the NOC (certainly no pun intended)!
Some useful links for you:
1. Creating an individual dashboard and adding the widgets you’d like to see in it
2. Creating a CCTV view by grouping these individual dashboards with the desired refresh interval
--
Kalvin
Team OpManager
Network monitoring software from ManageEngine
About NOC screens:
Wall mounted LCD/ Plasma screens are typically used by different IT teams for various network monitoring, fault management, and helpdesk purposes. The screen's visuals are rotated every few minutes at a pre-configured interval. For example, a view of
- Essential devices' availability statistics
- Top interfaces with high bandwidth utilization

- Availability status of the business critical services and applications
- Recent alarms or un-acknowledged events
- A network map showing the remote branches or datacenters connectivity and link performance
- Helpdesk ticket queues
- Recent call tickets & more…
Here's how OpManager can help make best use of your NOC monitor screens:
To begin with, one can customize the IT dashboard to display required network performance information using the 90+ out-of-the-box widgets. The widgets always get the most recent polled information. One can then create multiple dashboards e.g. an exclusive availability and performance dashboard for the network devices, a separate one for the datacenter and server etc.
Obviously the big screens have an expanse of usable real-estate. One can increase the number of columns on each dashboard and decide on how much space each column should occupy.

After creating a couple of dashboards, you can group these dashboards in a CCTV View with a custom-configured refresh interval. You can also have multiple CCTV views. You can then click on these CCTV views to pop them out in a new browser window to place them on to another big screen.
One can also get another web application or other web feeds within OpManager’s dashboard using the “Custom HTML or Text” widget.

By the way, these features are available in all the stand-alone OpManager editions and requires no extra module or web-servers. Try out these nice dashboards and have a blast in the NOC (certainly no pun intended)!
Some useful links for you:
1. Creating an individual dashboard and adding the widgets you’d like to see in it
2. Creating a CCTV view by grouping these individual dashboards with the desired refresh interval
--
Kalvin
Team OpManager
Network monitoring software from ManageEngine
[...] Blogs を翻訳・加筆したものです。 元の記事(2010年6月3日投稿)はこちら (翻訳: ゾーホージャパン、山路) Tweet (function(d, s, id) { var js, [...]
Hi Kalvin, you are right about the big LCD screens, we're currently building a bit of a NOC and putting the network/weather/sports up on the 36" screens is important to the final look. I've noticed though that when creating a Dashboard with only one column (100% width) and inserting a Business View containing a map, there's still a fairly wide border on the top and sides - at least 10% of the sides are just blank white. Is there any way to make a true full-screen Business view that uses all of the available real estate? thanks, Adam
Hi Adam, Try using the CCTV view, this should help you reduce the white space around the dashboard. -Kalvin