Analyzing ART using NetFlow Analyzer
Network administrators evaluate an application’s performance by measuring response time, round trip time, packet loss, and delay. However, this method poses certain limitations because you can monitor only the applications, servers, and network devices within the hosted network boundary. And, if the applications are hosted in the cloud, monitoring is almost impossible.
When users complain of delayed response from applications hosted in the cloud, the actual delay could be due to the application, client network, server network, transaction, or response time. Therefore, tracking the actual reason could be a cumbersome, time-consuming, and tedious. In such scenarios, the network admin needs a powerful tool like Cisco Application Visibility and Control (AVC) that helps analyze these metrics in a jiffy!


 Using these reports, a network admin can easily narrow down the problem. If the problem is on the client network, the admin might reinforce some strong QoS policies on the edge router to prioritize business-critical application traffic. And, if the delay is due to the application or server network, the cloud service provider may have to tweak the service.
Watch this space for more on application performance analysis. In the next blog, we’ll discuss the benefits of another technology that’s part of Cisco AVC.
Using these reports, a network admin can easily narrow down the problem. If the problem is on the client network, the admin might reinforce some strong QoS policies on the edge router to prioritize business-critical application traffic. And, if the delay is due to the application or server network, the cloud service provider may have to tweak the service.
Watch this space for more on application performance analysis. In the next blog, we’ll discuss the benefits of another technology that’s part of Cisco AVC.
Implementing AVC
AVC combines several technologies to help network admins quickly analyze and narrow down the bottlenecks. One of the technologies that AVC uses is application response time (ART). Using ART, you can gauge the performance of thousands of applications on the network. The following scenario helps explain how this works. Company A has subscribed to various cloud services and primarily uses WebEx to host online web sessions, TelePresence for video conference, and Dropbox for online storage. Let’s say there is a drop in the performance of WebEx and Telepresence. The company already runs on Cisco technology with the Cisco ISR g2 platform as its WAN router, the network administrator configures Cisco AVC ART on the Cisco ISR platform as follows:flow exporter NFAdestination 172.18.158.71source GigabitEthernet0/0output-features transport udp 9996export-protocol netflow-v9template data timeout 60option interface-tableoption application-tableoption application-attributesoption metadata-version-table!!class-map match any NFA_ART match any ! !flow record type mace NFAcollect ipv4 dscpcollect interface inputcollect interface outputcollect application namecollect counter client bytescollect counter server bytescollect counter client packetscollect counter server packetscollect art all!!flow record type performance-monitor NFA_NBARmatch ipv4 tosmatch ipv4 protocolmatch ipv4 source addressmatch ipv4 destination addressmatch transport source-portmatch transport destination-portmatch interface inputmatch interface outputmatch flow directionmatch application namecollect datalink dot1q vlan inputcollect datalink dot1q vlan outputcollect routing destination ascollect routing next-hop address ipv4collect ipv4 dscpcollect ipv4 idcollect ipv4 source prefixcollect ipv4 source maskcollect ipv4 destination maskcollect transport tcp source-portcollect transport tcp destination-portcollect transport tcp flagscollect transport udp source-portcollect transport udp destination-portcollect counter bytescollect counter packetscollect timestamp sys-uptime firstcollect timestamp sys-uptime last!!flow monitor type performance-monitor NFArecord NFA_NBARexporter NFAcache timeout synchronized 60! ! flow monitor type mace NFA-ART record NFA exporter NFA!!policy-map type performance-monitor NFAclass class-defaultflow monitor NFA! ! policy-map type mace mace_global class NFA_ART flow monitor NFA_ART
Applying the monitor to interface and enabling MACE on the interface to collect ART metrics
interface GigabitEthernet0/0
ip address x.x.x.x
service-policy type performance-monitor input NFA
service-policy type performance-monitor output NFA
mace enable
Interpreting ART
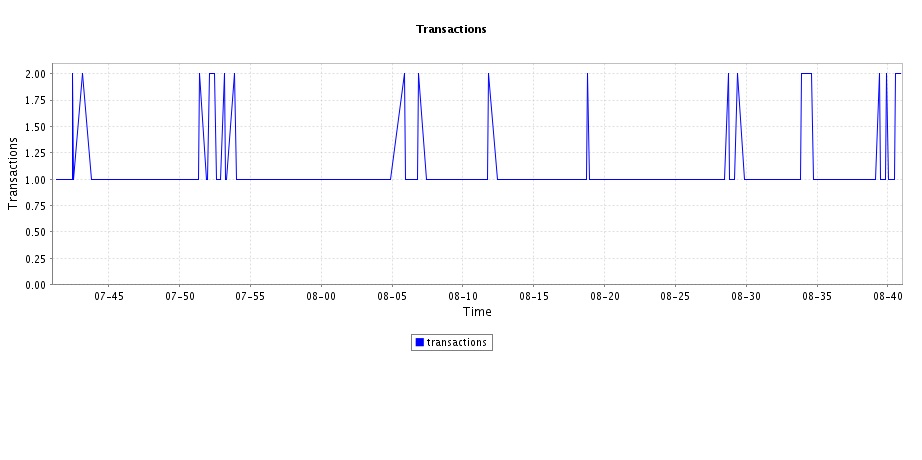
To interpret ART metrics, the easiest option is to parse them using a NetFlow analysis tool such as Netflow Analyzer from ManageEngine. NetFlow Analyzer brings with it easy-to-use bandwidth monitoring software. In addition, NetFlow Analyzer supports Cisco AVC and can be deployed anywhere on the network to collect metrics and generate reports. Here are some of the ART reports that NetFlow Analyzer generates:Using these reports, a network admin can easily narrow down the problem. If the problem is on the client network, the admin might reinforce some strong QoS policies on the edge router to prioritize business-critical application traffic. And, if the delay is due to the application or server network, the cloud service provider may have to tweak the service.
Watch this space for more on application performance analysis. In the next blog, we’ll discuss the benefits of another technology that’s part of Cisco AVC.