Enhanced Reports in NetFlow Analyzer -- Part 1
At Manage Engine NetFlow Analyzer, we have always concentrated on having a simple, easy to understand GUI which can give the results you are searching for within minimal number of clicks and less than a minute. If you have used NetFlow Analyzer you certainly must have seen all the reporting options. If you have not, check our Online Demo to know how easy things are.
NetFlow Analyzer Version 8 brought in many features like VoIP monitoring, SNMP V3 and Cisco ASA support, Flexible NetFlow based NBAR, Geo Locations and so on. But along with these vertical enhancements, we have also topped up the reporting capabilities to help users get more from the product. I will explain some of the enhancements we made in Version 8 through this blog.
Consolidated Device Reports:
Until the last version, Consolidated report was available for Interfaces and IP groups. This single page report lists the traffic graph for a selected interface or IP group with the top 10 Applications, Source and Destination for IN and OUT directions. Same as consolidated report for Interface or IP group, NetFlow Analyzer 8 provides an option to generate a consolidated report for a device itself.
Consolidated Report for a device lists traffic graph with Top Interfaces based on Utilization and Speed, Top Application, Protocol, Source, Destination, Conversation, DSCP etc. This report can be generated for last hour and up to last 24 hours. With this report, NetFlow Analyzer provides a view of traffic at the device level giving you an idea on the high usage devices. The report should help get a more detailed visibility on device traffic, narrow down on the performance of device in relation to traffic passing and helps understand the traffic pattern on the devices.
This Report can be generated by clicking on Device Name or IP address from the Interface View or Dashboard.


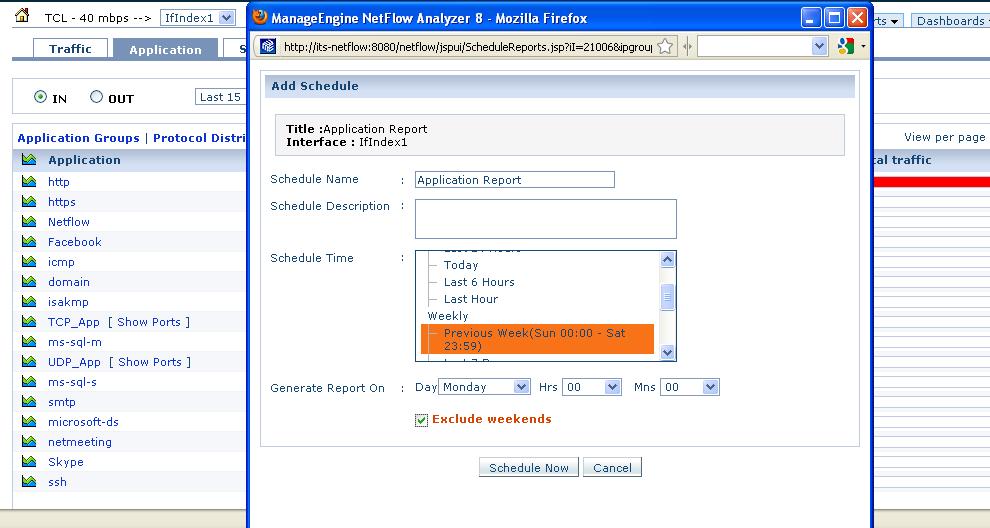
Enhanced Schedule of Reports.
Schedule reporting option lets users create reports about the information they need and have it automatically emailed to them on a daily, weekly or monthly basis. The reports can be send to multiple email addresses defined by the users and the reports are also saved within the product for later access. Until the last version, only two types of reports were possible, Consolidated Report and Custom Report, both of which could be scheduled for Interfaces and IP groups.
Version 8 introduced the "One Click" Schedule option. This allows users to create schedules for any report they see on the screen. Say, you are looking at a Application report for an interface and you would like to have it emailed to you, use the 'Once Click' schedule.
The reports (for Traffic, Application, Source, Destination, Conversation, QoS, NBAR, CBQoS, etc) can be scheduled for Interfaces and IP groups using the one click option. You now don't have to go into Schedule Settings, create schedule and etc. This one click schedule is keeping in tandem with our aim for fewer clicks and faster reporting.

This is not it. We do have other enhancements in reporting like 'Global Search', '5, 10 and 15 minute averages' and will walk you through them in our next blog.
Demo| Download 30-day Trial | Twitter | Customers
Regards,Praveen Kumar