Monitoring Load balanced WAN links
The increasing dependency on the Internet for business necessitates the need for reliable WAN connection. Link outages and slow connectivity cannot be afforded in the Web 2.0 era where a higher volume of transactions takes place online. In such a scenario, having a fail over link always helps but having the ability to use both the primary and the fail over link at the same time essentially provides higher bandwidth capacity and thus improved performance for business critical traffic.
WAN Load balancing is the feature that helps achieve the mentioned requirements and much more. With load balancing in a network, an organization can have multiple WAN connections from different Internet Service Providers and thus giving the edge device two (or more) paths to choose from for application delivery. This provides higher bandwidth for connectivity between sites, application delivery even in case of a WAN outage, improved performance for critical traffic by using the fastest link and at the same time not overburdening any link through even distribution. The network administrators get more control of traffic with load balancing letting them dynamically choose the best path based on availability, performance, cost and etc of the ISP links. The link to be utilized is determined by algorithms ranging from ones like round robin to advanced ones which takes into account a variety of factors like bandwidth utilization, latency, round trip time, cost and etc.
Monitoring the links separately is useful to see which applications used which link, to where each link was sending the traffic and who were the source of traffic being sent. At the same time, it is also important to see the combined performance of the links to understand the total link utilization and application performance.
Most of the bandwidth monitoring tools lets you see the status of each link seperately. But to get a combined statistics, one has to analyze the data for each link and calculate the combined performance. A time consuming, slow and monotonous task to be performed everyday? Not when you have ManageEngine NetFlow Analyzer. NetFlow Analyzer lets users group together interfaces to see them as a single category and generate bandwidth and traffic reports.
To create an Interface Group, navigate to Admin Operations -> Device Groups -> Interface Group tab and from here select the interfaces you would like to group together. You can set the group name and the combined speed for the links for utilization calculations. Once the Interface Group has been created, it can be seen from the 'All devices' view.
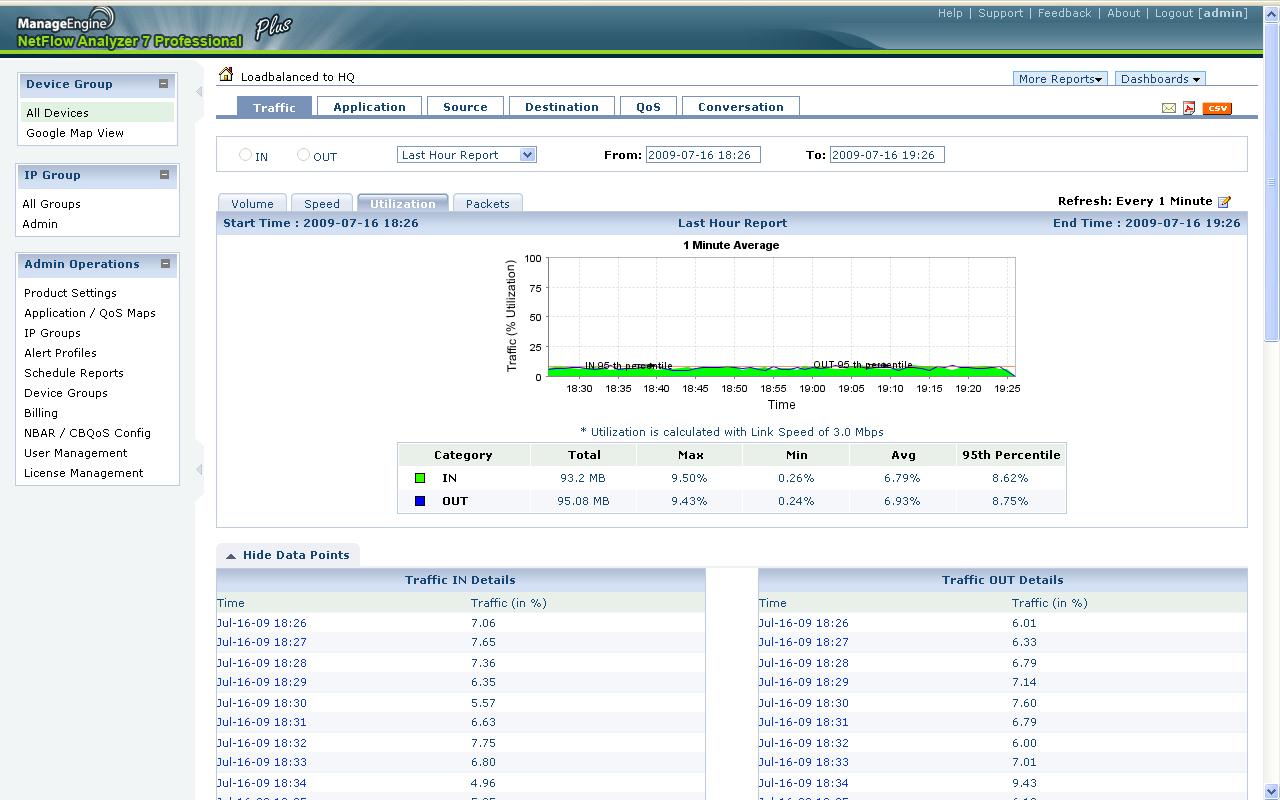


A user can drill down on the Interface Group to see the combined traffic based on volume, speed, utilization and packets and can also see in depth reports about the applications used, protocol distribution, the source and destination of traffic, the DSCP priority for each traffic that passed through the interfaces and all the conversations. Even more, you can generate consolidated reports to see the top 10 users and can compare the interface groups with other such groups or even compare the traffic pattern for the same group over various time period. The reports generated can be emailed using single click email or exported as PDF or CSV format.
The combined view of the interfaces helps you make instant decisions on capacity planning, traffic prioritizing and traffic controlling. With more control on WAN traffic and real time reports on bandwidth, network administrators can sit back to play game of Pacman during non peak hours !
Feel free to give a try to the 30 days NetFlow Analyzer trial edition which runs with no feature limitations. Download NetFlow Analyzer from here or view live demo of NetFlow Analyzer from here. Do email your queries to netflowanalyzer-support@manageengine.com
Don Thomas Jacob
[..] This postwas [..]