
Data centers are essential. Not only do they handle the network traffic from your organization to your end-users, but data centers also enable seamless communication and collaboration with various business stakeholders. This makes data center monitoring all the more imperative.
An efficient data center management strategy must encompass the infrastructure layout, topology, and business-level connectivity, which is like having a map before starting on a quest. This guarantees that, despite any challenges, you will stay on track and make well-informed decisions based on the relevant factors at each stage of the journey .For example, having an overview of your data center's visual representation helps you proactively identify and resolve issues even before they crop up. This visualization serves as a compass in the quest of your data center monitoring journey, helping you end up in the right place.
The following are some of the challenges in gaining visibility into your data center:
- The conventional practice of using spreadsheets to maintain information about serial numbers and IP addresses cannot be scaled with the evolving IT landscape.
- Gaining a single pane of glass view into the entire data center stack is incredibly difficult.
- Overcoming visibility blindspots is also difficult due to the complicated infrastructure.
- Understanding the connections between your network devices and auxiliary systems is also challenging.
An end-to-end network monitoring and visualization solution addresses these challenges and helps you monitor your network in real-time. This grants you complete visibility into your infrastructure devices, layout, and connectivity while giving you comprehensive information about the devices in picture.
ManageEngine OpManager: The must-have in your data center management arsenal
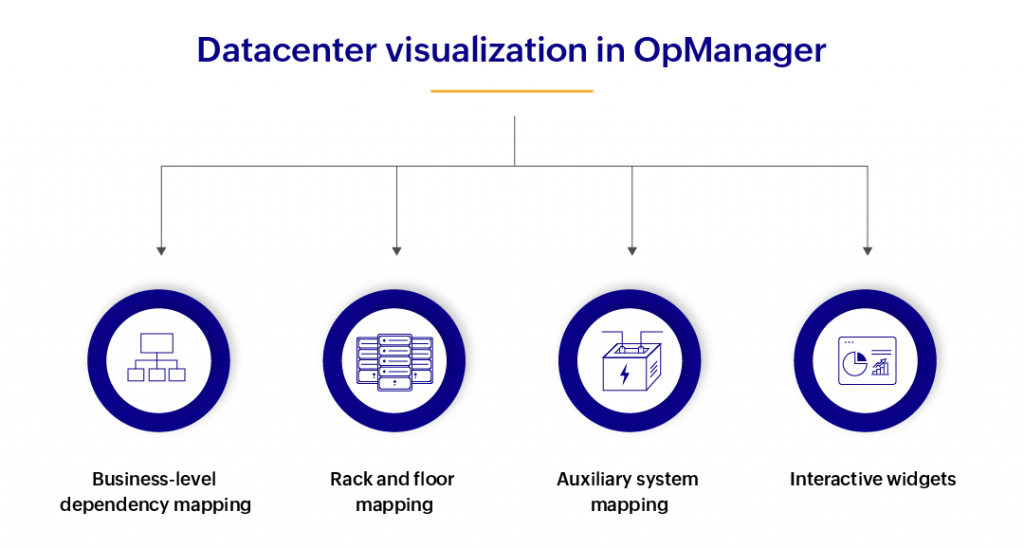
ManageEngine OpManager is a comprehensive network monitoring and visualization solution that helps you get rid of the blindspots in your network, and ensure optimum network performance. Using OpManager, you can visually model your data centers, helping you gain clear insights into your data center's connectivity and layout. The following are some of OpManager's features that can help you with
visually modeling your data center.
.
Business-level dependency mapping
In any data center, business-critical devices might be spread across different factions of the network and different subnets. Given their significance, you must ensure their peak operational health and performance. Using OpManager, you can group business-critical devices or devices catering to a specific business category together, while also customizing their background image. You can even visualize the link between the devices, helping you monitor their connectivity and traffic load. Also, you can group network devices geographically, or by any other criteria, and proactively resolve the bottlenecks found.
Rack and floor mapping
OpManager's 3D rack view and floor views help you visualize your device connections across racks and floors. You can also choose to either visualize their racks across two-dimensional or three-dimensional views. You can use simple drag-n-drop actions to create visual models of your racks and floors, helping you have needle-in-the-haystack visibility. Also, clicking on a device takes you to the respective snapshot page, helping you gain comprehensive information about the device.
Auxiliary system mapping
Auxiliary systems are supporting systems such as power sources, cooling systems, and much more. These systems directly support the primary network infrastructure, and their optimum performance is incredibly crucial to the sustainable operation of the infrastructure. OpManager allows you to correlate the connection between your devices and the auxiliary systems. You can drag and drop the supplementary systems along with the respective devices to the racks, helping you have a complete picture.
Interactive on-the-go widgets
OpManager's interactive widgets, dashboards, and NOC views grant you a single point of visibility into your entire data center stack. You can add the data center floor views and rack views as widgets, which can further be embedded on dashboards or NOC views. This helps you continually monitor and visualize your data center and also identify any potential bottlenecks that might head your way.
Round-the-clock visibility into your data center stack with ManageEngine OpManager
ManageEngine OpManager offers more such
out-of-the-box visualization features that helps data center admins gain not just fragmented pieces of information, but the whole picture. With continual visibility into your data center stack, you can convert real-time visualization into actionable insights. This helps you make well-informed decisions, and scale resources at your will.
Download OpManager to have a hands-on experience. To have a technical demo of the product assisted by our product experts, kindly
register here