Database monitoring for beginners: 6 steps to get you started
Why do you need database monitoring?
Databases are the backbone of the digital world. They are the organized repositories of information that power everything from simple websites to complex e-commerce platforms and social networks. If computing elements are likened to engines powering information processing, databases serve as the fuel tank, essential for storing and delivering data. Databases ensure proper access, delivery, and management of your data. That's why it's essential to monitor and observe your databases to maintain their performance, availability, security, and scalability.By monitoring databases, you can:
Optimize database performance.
Anticipate usage and plan capacity.
Proactively identify performance degradation or lag.
Preempt issues.
Detect and troubleshoot faulty areas.
Maintain SLAs.
How to monitor databases properly
Having outlined the benefits of database monitoring, let's now turn to the practical aspects of implementing it effectively. By taking control of your database monitoring, you can unlock your database's full potential and achieve a reliable and efficient data infrastructure.
Whether you're a seasoned database administrator or just starting out, consider this section your go-to guide for mastering database monitoring, where you'll find valuable insights and actionable steps to help you implement an effective database performance monitoring tool strategy.1. Craft your monitoring roadmap: Define what you want to measure and why
Treat monitoring like a journey. Before setting off, define your destination (performance goals) and milestones (service-level objectives, or SLOs) to ensure you arrive where you want to be, both for your business and your users. These goals should align with business and user expectations. Once you have your goals in sight, pinpoint the KPIs that will light the path. Basic metrics lay the foundation, and advanced metrics offer granular details, which are essential to unearth the behavior of underlying operations that would otherwise go unnoticed. Start with core metrics, like response time, throughput, and resource utilization, then dive deeper into crucial parameters, like queries, storage, concurrency, replication, indexes, errors, and exceptions, for comprehensive database and application monitoring.2. Choosing a database monitoring solution: A tailored approach
When it comes to choosing a monitoring solution, there are two primary things to look out for:
- Does the tool support the databases in my infrastructure?
- Does it support the metrics I want to monitor?
Instead of choosing a generic database monitoring tool, consider your specific needs and choose a solution that aligns with your database type (e.g., MySQL, PostgreSQL, Oracle, MongoDB), architecture, and roadmap defined in step 1. This allows you to tailor your monitoring to your specific requirements and maximize its effectiveness.
Here are a few other questions to consider:
- Does it align with my team's technical expertise? Choose a solution that caters to your team's skill level and requires minimal training.
- Does it have additional features that could be beneficial? Some solutions offer advanced features like anomaly detection, ML-based insights, and automated remediation actions.
 Applications Manager is an uncomplicated monitoring software that is quick to set up and easy to use. We offer regular training sessions to equip both new and veteran database admins with the skills to master our monitoring solution.
3. Create dashboards and alerts: Transform data into digestible insights
Transform raw data into insightful dashboards. Leverage Applications Manager's database monitoring dashboards to visualize key metrics, giving you a real-time pulse on your database's health and performance. Ditch the data deluge and curate a personalized dashboard of hand-picked metrics. This targeted approach grants you instant visibility into key indicators, empowering you to proactively address potential issues before they become problems. Establish clear thresholds for key metrics like response time, resource utilization, and error rates. Then, configure intelligent alerts to notify administrators the moment those lines are crossed. This proactive monitoring empowers you to address issues before they escalate. With Applications Manager's fault management capabilities, it's easy to build thresholds that can be user-defined or adaptive. Get instant alerts on all your interfaces whenever there's a violation or configure automated actions to be performed to reduce manual interference.
4. Analyze, optimize, and elevate your databases' potential
Correlating the behavior of key metrics, like query execution time, disk space utilization, and connection spikes, can reveal hidden relationships and potential performance issues. Sudden spikes or drops can indicate potential performance bottlenecks, resource constraints, or even suspicious activity. By comparing current metrics with past baselines, you can understand normal behavior and quickly spot anomalies that might otherwise go unnoticed. Our performance reports transform raw historical data into actionable insights, revealing subtle trends and identifying areas for optimization. Track trends, analyze performance metrics, and gain a holistic understanding of your database's health.5. Future-proof your resources: Anticipate demand and plan capacity
Analyze data patterns to forecast future workloads and build a database infrastructure that seamlessly adapts to your growth trajectory. Stay ahead of the curve and avoid costly over-provisioning or under-provisioning. Applications Manager's AI-powered intelligent forecast and capacity planning reports analyze historical data and predict resource needs for up to three years, giving you a clear roadmap for resource allocation and infrastructure scaling. Leverage these forecasts to scale your database resources dynamically, ensuring seamless performance, and optimize operational costs, regardless of demand fluctuations.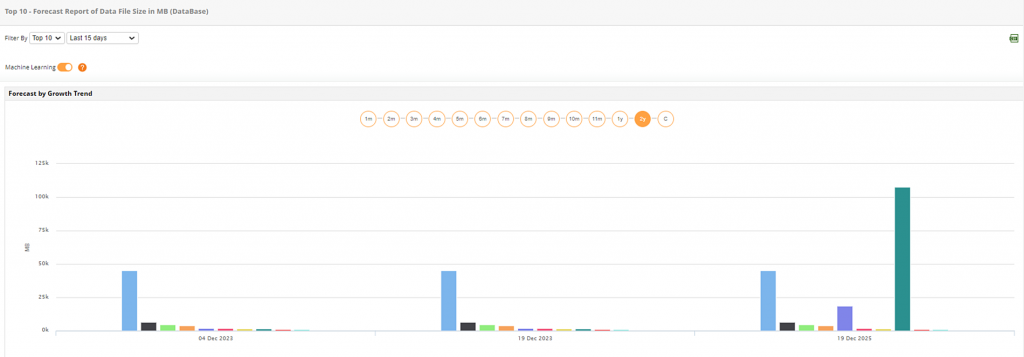
6. Optimize, don't stagnate: Continuously monitor and refine your workflows for sustained success
Embrace a culture of continuous improvement for your database. Fuel continuous optimization with data-driven insights from monitoring and analysis. Tune queries, indexing, and configurations like a pro, keeping your database operating at peak efficiency. Applications Manager dives deep, revealing slow queries, resource hogs, and hidden inefficiencies. Compare your database to ideal benchmarks and identify subtle performance dips before they become critical problems.
Regularly refresh your database and monitoring setup to keep pace with changing needs and technologies. Ensure it reflects your evolving business landscape and stays ahead of the curve. Conduct periodic monitoring audits to ensure your setup aligns with your business goals and leverages the latest tools. This proactive approach keeps you in control and empowers data-driven decision-making.
Applications Manager: Your comprehensive database monitoring solution
These steps will empower you to craft a sophisticated database monitoring system that goes beyond basic metrics. Investing in proactive monitoring is an investment in your database's future. Save yourself the time, cost, and frustration of reactive firefighting by building a system that preempts issues.
Applications Manager's proactive database monitoring and optimization capabilities lead to faster query execution times, reduced resource consumption, and a smoother user experience. Streamline your monitoring strategy and make informed decisions regarding your database infrastructure and performance optimization with its data-driven insights. If you're looking for a comprehensive and effective way to monitor your databases, Applications Manager is the way to go. Go from reactive to proactive: Start your free, 30-day monitoring trial today!