6 Linux server performance metrics to look out for

Linux is one of the best known and most used open source operating systems. The key advantages of using Linux servers are that they are stable, secure, compatible, and customizable.
Since Linux servers form the backbone of any IT infrastructure, if there is a sudden spike in memory or CPU usage, the performance of your applications will be affected. To ensure optimal performance of your Linux server monitor and seamless operations of the applications that rely on your servers, it is crucial to utilize a monitoring solution. ManageEngine Applications Manager provides proactive Linux performance monitoring and helps you quickly identify and resolve issues before end users are affected. Our Linux server monitoring dashboard will help you visualize all the key Linux server metrics in one place.
Key Linux server monitoring metrics
Let’s take a look at the top six key Linux server performance metrics you need to monitor to keep your servers up and running.
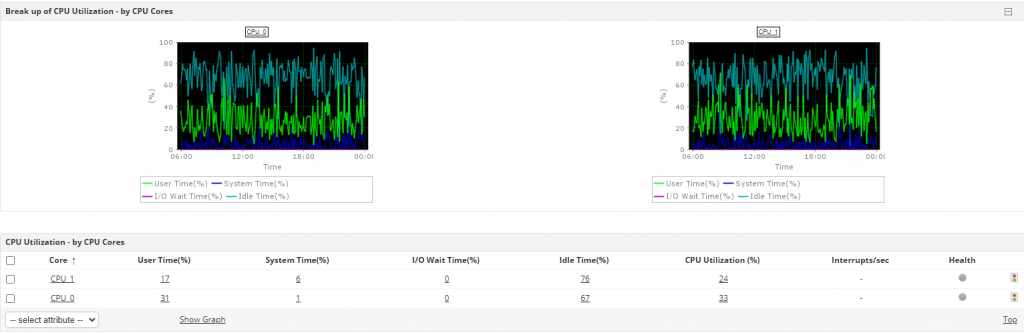
1. CPU usageCPU usage is one of the first places to look when a Linux server shows signs of slowing down. Monitoring CPU usage regularly will help analyze the CPU load over a stipulated period and overcome performance regressions. CPU utilization for a Linux server is calculated using the "vmstat" command. Vmstat is a valuable memory utility that provides information about CPU activity in addition to memory. On multiple CPU systems, vmstat averages the number of CPUs into the output.

While monitoring Linux, it’s important to keep tabs on the CPU utilization percentage. CPU percentage represents the amount of time during which the system processes are active on CPU. Linux servers use the "mpstat" command to display the percentages. This command also accurately displays the statistics of CPU usage in the system by initializing the first processor with CPU 0, the second with CPU 1, and so on.
 2. System load
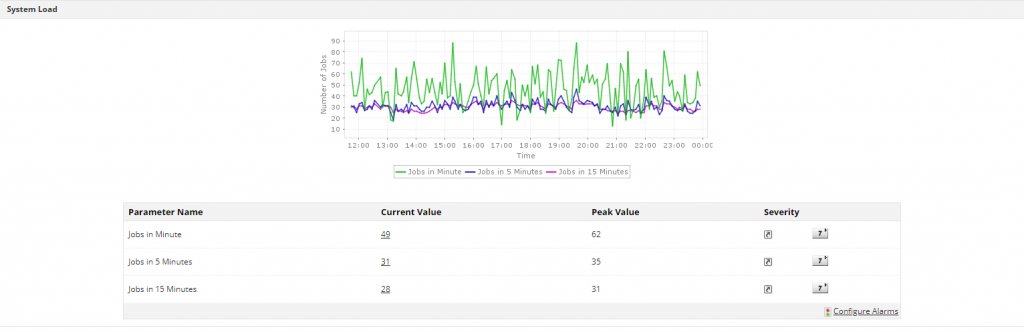
System load is one of the key Linux server monitoring metrics and is a measurement of the computational work the system is performing. System load averages, also called Linux load averages, show the running thread demand on the system as the average number of running plus waiting threads.
This metric represents the average number of instructions waiting for CPU time and the overall demand for CPU. Average system load is calculated over a given period of one, five, and 15 minutes. Load average should be equal to the total number of CPUs in a system.
To understand this better, let’s consider two cases:
- Single processor:For example, consider a fully utilized single processor system CPU that has a load average of 1. Any load average less than 1 indicates that the CPU is underutilized, and a load average greater than 1 indicates overutilization of CPU.
If the load average in a single processor system CPU is 1.7, then the CPU instructions will be forced to wait until the preceding ones are executed.
- Multi-processor:
Let’s consider a six-CPU system. If this system has a one-minute load average of 6.06, then it means there is no remaining capacity among the six CPUs and very few instructions will be forced to wait. A perfectly utilized six-CPU system will show a load average of 6, which indicates that the system is fully loaded but not yet overloaded. It is critical to ensure that every CPU is fully utilized and no instruction is forced to wait. Keeping tabs on CPU system capacity will also give you insight into the overall utilization trend.
3. Memory utilization and processes
Monitoring memory helps you identify over- and underused servers and redistribute loads effectively. Memory usage is calculated using the "free" command. The free command provides insight into swap space and the amount of used and unused memory.
Memory utilized = ((Total - Free)/Total * 100)
whereas Free memory = (Total - Used + Buffer + Cache)
Swap memory is the virtual memory created by the system, whose primary function is to substitute for disk space when physical memory is full and more space is needed.
For example, let’s assume you are working on a computer system with 4GB of RAM. As long as the applications running in your computer don't fill up the RAM, no swapping is required. When the applications do fill up the RAM, the lesser-used files will be moved to the swap space until they are needed and the new files will be swapped to RAM. Visibility into physical and swap memory helps you plan resource usage and avoid data loss.
An important element that Linux server monitoring software helps keep tabs on is processes. Each processor runs in its virtual address space and does not interact with other processes. Monitoring every process running on your Linux server will help you evaluate system performance, debug issues, and optimize server processes.
4. Disk utilization

Monitoring disk utilization helps you maintain the efficiency of a Linux system and minimize the risk of hardware failure. Tracking this metric regularly provides insight into the amount of disk space that is currently available in your Linux server.

The disk I/O metric displays the current I/O usage by processes or threads in the system. Disk read and disk write metrics will provide insight into how much a process has written to and read from the disk since the process started.
5. Inode usage
In a Linux server, everything is a file. Linux systems use inode numbers instead of file names to identify files/directories while they are being created. These file systems contain two parts: metadata and actual data. Each file has an inode that contains metadata about the file. An inode stores all the information regarding the file, including file size, file location, device ID, user ID, group ID, file access privileges, and time stamps. Each inode has an inode number that is unique within a file system.

All the inodes are held in one table. Using the inode number, one can easily calculate the offset into the inode table at which the inode is located. Since every file has an inode, the potential issue is that all the inodes of a disk might be completely used even before the disk is full.
Optimal Linux server monitoring tools will help you track inode usage details that usually reveal a lot of information about the number of nodes consumed and the amount of space left. Receiving alerts when inode usage exceeds a set threshold can help avoid potential performance issues. You can reduce inode usage by deleting unused files.
6. Cron jobs

Cron is one of the most useful metrics in Linux, as it allows you to run automated processes, like backups, schedule updates, and file synchronization, at specific periods. The cron jobs can be set to run by the minute, hour, and day of the week or month. Since cron is a daemon that is scheduled to run tasks, it wakes up every minute to check scheduled tasks. Tracking how long your cron jobs usually run with the help of an efficient Linux server monitoring tool will help you receive customized alerts in case they run too slowly.
Monitoring with ManageEngine Applications Manager
If you're a system or network administrator, you know how tough it is to monitor and debug Linux system performance problems. ManageEngine's Linux server performance monitoring tool, Applications Manager, helps you ensure optimal performance of various Linux distributions, such as Red Hat Linux, Red Hat Enterprise Linux, Mandriva, Fedora, SUSE, Debian, Ubuntu, and CentOS. You can also use Applications Manager to monitor and troubleshoot over 130 applications and infrastructure elements, such as application servers, databases, web servers, containers, VMs, as well as cloud resources.
Monitor Linux server performance with Applications Manager today! To experience everything we have to offer, start a 30-day free trial or schedule a personalized demo.Applications Manager is a part of ManageEngine ITOM suite of solutions. Apart from Applications monitoring, ITOM also has solutions to streamline network monitoring, server monitoring, bandwidth monitoring, configuration management, firewall security and compliance, IP address management and switch port management. Truly, this makes ITOM solutions an ideal choice for over 1 million IT admins, worldwide.