
Applications built on the Node.js platform, an event-driven I/O server-side JavaScript environment based on Google Chrome’s V8 engine, are known as Node.js applications. Since both the server-side and the client-side are written in JavaScript, Node.js facilitates easier and faster implementation of codes, and processes requests quickly and simultaneously; this is greatly beneficial for building real-time applications, especially chat and streaming applications.
Netflix, LinkedIn, Yahoo, and eBay are some of the most popular applications built on the Node.js framework. What separates Node.js from the rest of the framework family—PHP, Ruby on Rails, and Python—is its ability to easily scale, flexibility to be altered, and fast delivery of prototypes.
If Node.js is so efficient, why do you need to monitor it?
Running large-scale enterprise Node.js applications not only requires scalability and flexibility, but also the guarantee that services are available and performing as expected. Companies can lose customers if they aren’t able to meet service-level agreement (SLA) terms due to downtime or poor performance of applications in production. As the cost of development is an important factor to consider, it becomes vital to monitor the performance of critical applications and gain insight into errors quickly.
While digging deep into Node.js application performance, DevOps teams face challenges in the following areas:
-
- Debugging
- Error handling
- Metric monitoring
Debugging refers to removing errors in your application code, while error handling refers to the correction of flaws in the code and algorithm in an attempt to optimize it. With the help of a robust Node.js application performance monitoring tool, you can recognize the problematic areas in your application code, spot the source of faults, and identify performance degradation in your applications.
ManageEngine Applications Manager comes with a powerful fault management system—consisting of a root cause analyzer; adaptive, static, and dynamic threshold configurations; anomaly profiles; and automated corrective actions—to help you with both debugging and error handling.
Tracking Node.js element data and aggregating it over a period of time will help you understand application behavior, and also anticipate any degradation in performance. Some of the metrics you need to look out for are:
-
- Response times
- Dependency management
- Event loop lags
- CPU usage
- Memory leaks
Here’s how Applications Manager can help you improve the performance of your Node.js applications in these areas.
Response times
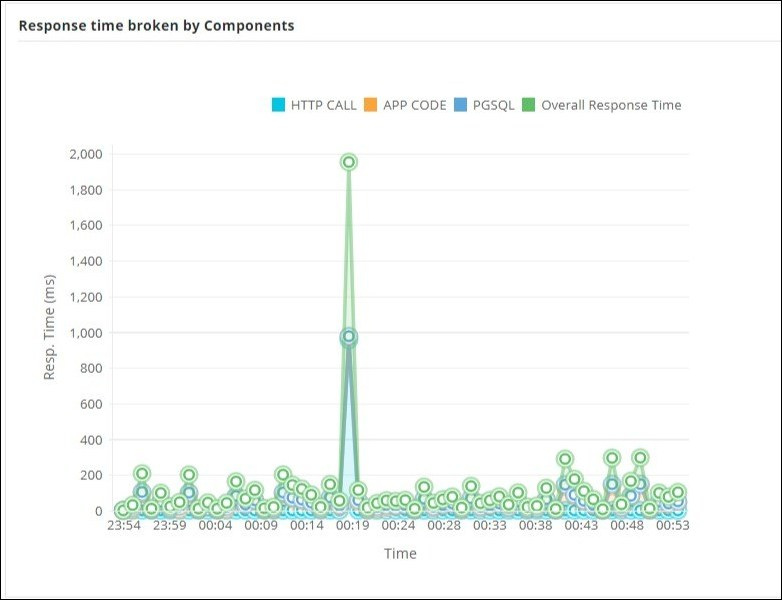
Monitoring response times is critical, no matter the type of application. Response times provide information about the areas that degrade application performance, which makes troubleshooting easy.
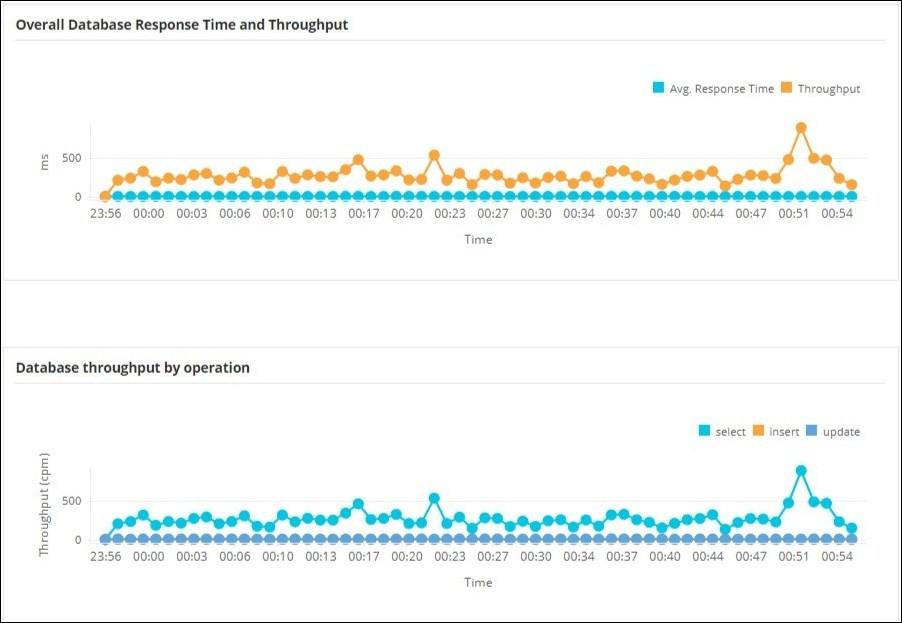
With Applications Manager, you can monitor the response times of transactions, database operations, and traces. The break up of response times with respect to the operation performed and the elements on your web applications are presented on Applications Manager’s dashboard, which can help you deduce which transactions and components are time-consuming.
Errors and exceptions
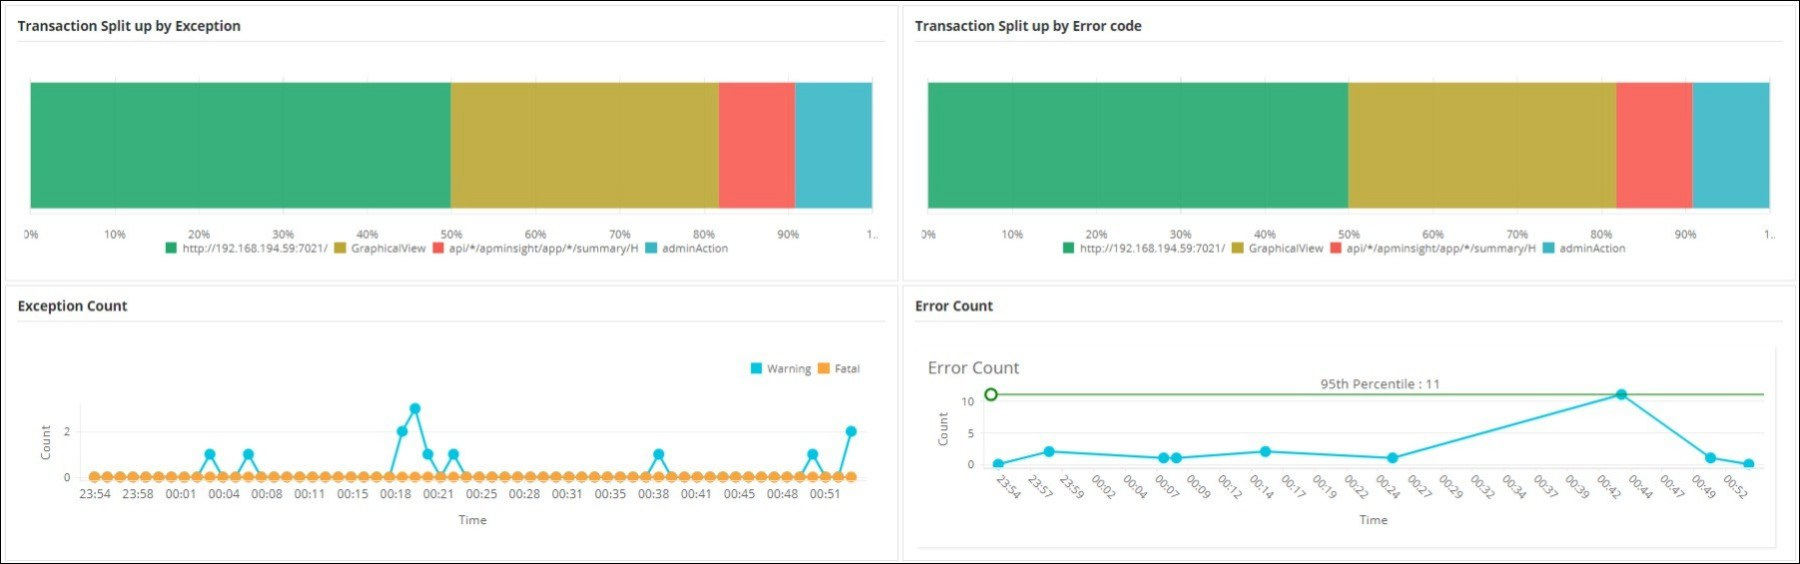
Node.js includes only a handful of predefined errors, like RangeError, SyntaxError, etc., all of which are runtime errors inherited from Error. It’s important to understand the nature of errors to identify whether it’s an operational or programmer error.
Applications Manager provides essential information such as the count of errors and exceptions, types of error codes and their frequency, types of the exceptions and their frequency, and the top errors and exceptions.
Dependency management
Relying on foreign components for your module to run is part of development for most Node.js-based applications. As time goes on, mapping these dependencies becomes complex, especially when the code is borrowed from an open-source library.
A Discovery and Dependency Mapping tool—which Applications Manager also offers— presents the dependencies of your applications on various external software or components, enabling you to test their quality and availability.
Event loop lags
The event loop is a space where other requests exist when the main request is being processed by the Node.js thread. Although this helps in offloading operations to the system kernel to prevent blocking, taking up too many tasks at once or tasks that are time-intensive can result in slow responses.
Monitoring event loops can help you discover if the event loops are taking too much time to process or if the number of tasks per loop has increased, which leads to increased latency.
CPU usage
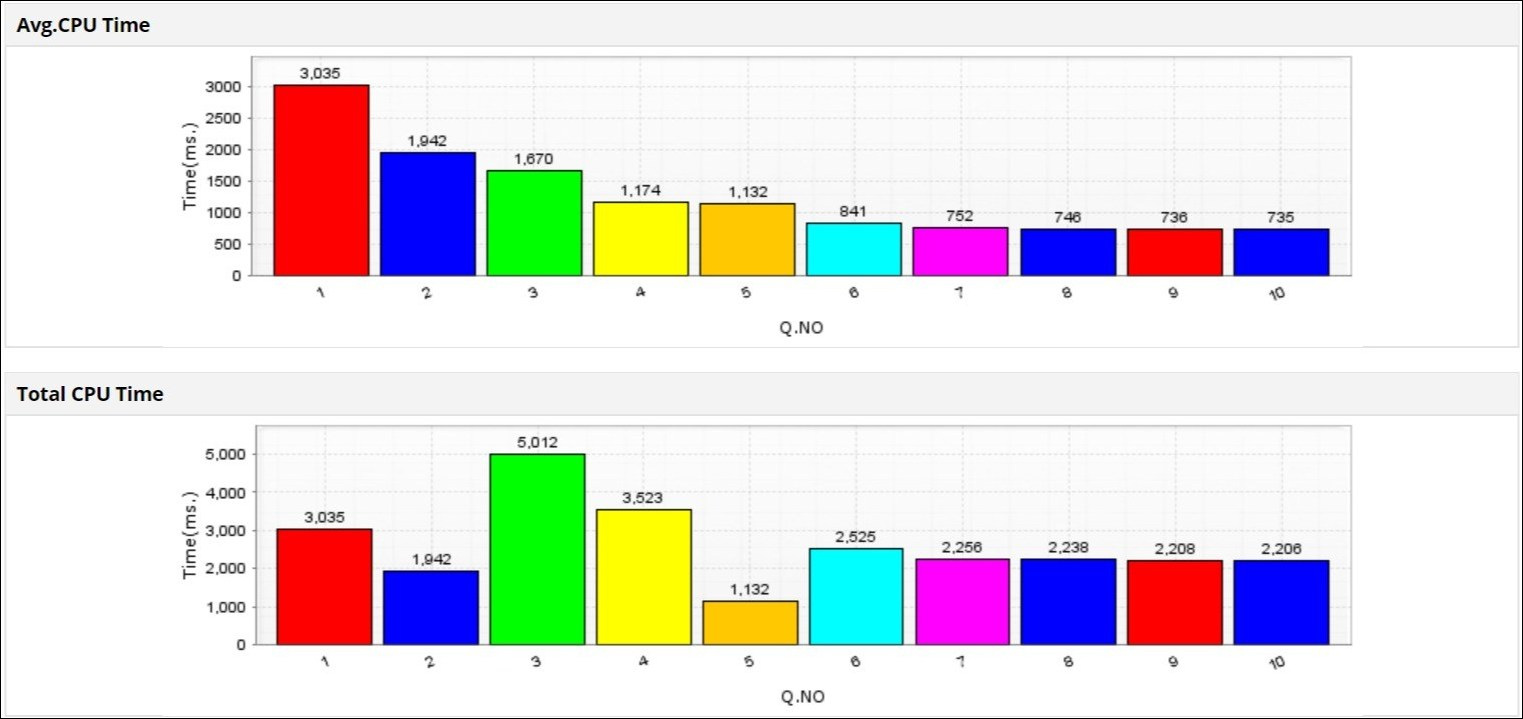
Unlike other frameworks, Node.js is a single-threaded system. This means that a single thread caters to all the client’s demands—Node.js takes all requests, then delegates most of the work to other system workers—as opposed to other languages, which create new threads for every request.
This thread is efficient and unaffected unless a CPU-intensive request is being handled. Therefore, CPU usage must be tracked constantly to ensure that the main thread is not overloaded, lest it ruin the tasks and slow down your applications. Applications Manager monitors the CPU used by Node.js applications to help you identify processor-intensive operations and assign them to other workers.
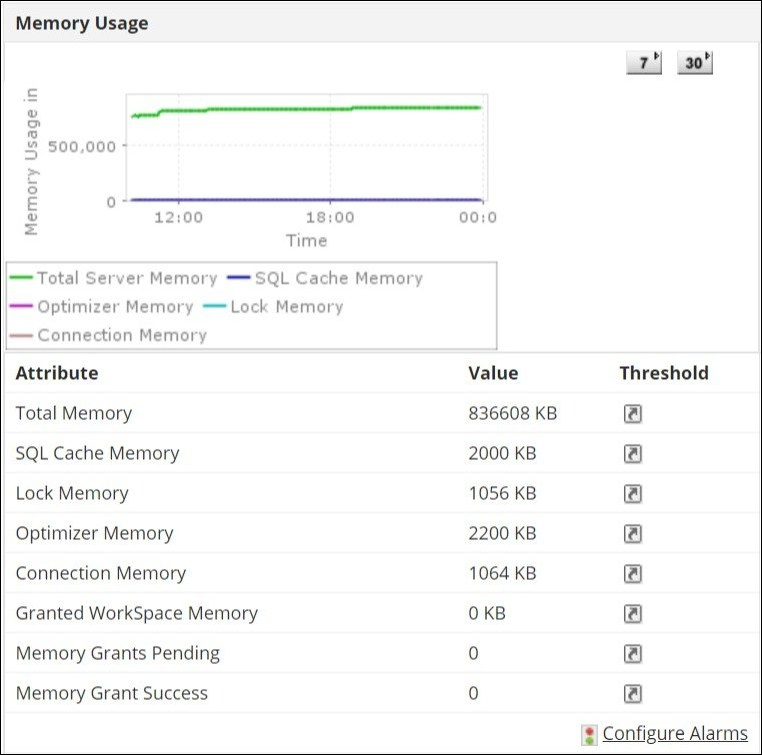
Memory usage
One of the limitations in Node.js is in its memory usage; only up to 1.4GB of memory can be used before a fatal error occurs. The V8 code originally ran in a 32-bit browser with very strict and enforced memory restrictions, and was then moved to a 64-bit one; this memory limitation may be a remnant from the days of its conception.
It’s imperative to keep an eye on the memory usage of Node.js applications to avoid errors. Applications Manager also provides host-level metrics like memory consumption and garbage collection stats to help you prevent memory scarcity and control memory leaks.
ManageEngine Applications Manager is an application performance management (APM), infrastructure, and end-user experience monitoring solution that supports monitoring over 130 technologies, all on a single console. Built for today’s complex, dynamic application performance management needs, you can even monitor homegrown apps with custom scripts. To experience everything Applications Manager has to offer, try a 30-day free trial, or schedule a personalized demo today!