Amazon Web Services (AWS) is one of the most popular public cloud providers today. Over the years, AWS’ services have expanded from cloud computing to application development and security. To retain the reliability, availability, and performance of your AWS instances, an AWS cloud monitoring solution is a must. Aggregating AWS performance metrics in one place will provide complete visibility on every component of your AWS infrastructure, which helps with debugging multi-point failure issues.
It’s important to have a complete understanding of AWS monitoring best practices. One vital best practice is monitoring key AWS metrics. In this blog, we’ll focus on some key metrics that most AWS monitoring tools use to monitor a widely-used AWS service: Amazon Relational Database Service (RDS). We’ll also touch on Amazon Aurora, a MySQL and PostgreSQL-compatible database (DB) that’s available as part of Amazon RDS.
Amazon RDS
Security, scalability, easy setup, high availability, and cost-effectiveness are some of the most prominent features of Amazon RDS. RDS supports six major DB engines: MySQL, PostgreSQL, MariaDB, Oracle Database, SQL Server, and Amazon Aurora. This wide range of support helps any application or tool work seamlessly with Amazon RDS.
To effectively monitor Amazon RDS using an AWS performance monitoring tool like Applications Manager, there are some key metrics you need to track. Some of the key metrics for AWS monitoring include:
CPU utilization
CPU utilization measures the percentage of allocated compute units currently used by your RDS instances and can also be used to track CPU performance decline or improvement.
Applications become unavailable when they reach their upper limits on CPU usage. Each instance is limited to a certain amount of CPU. Tracking CPU utilization across your RDS instances can help you determine if your applications are overworked or underworked. Leveraging the AWS metrics dashboard will help you assess the health of all your RDS resources.
Memory consumption
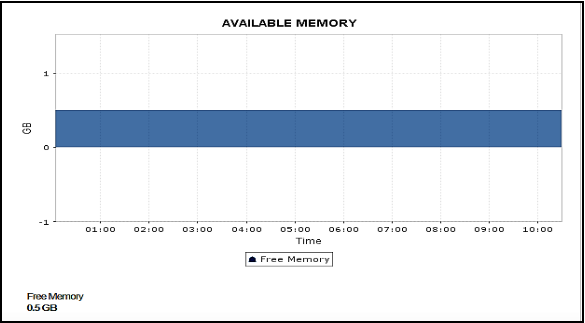
Maintain system performance and availability by setting up alerts for changes in memory usage patterns. Lack of storage space in DB instances can lead to data loss and application bottlenecks. Scale up your DB instance when you approach your storage capacity limits. To accommodate any unforeseen demands from your applications, it’s critical to have some buffer in storage and memory.
A low free memory value indicates that the DB is under memory pressure. If you encounter performance issues or there’s no free memory left, you need to upgrade to a larger instance. For optimal RDS monitoring, always make sure that your DB instance isn’t memory constrained.
Network traffic
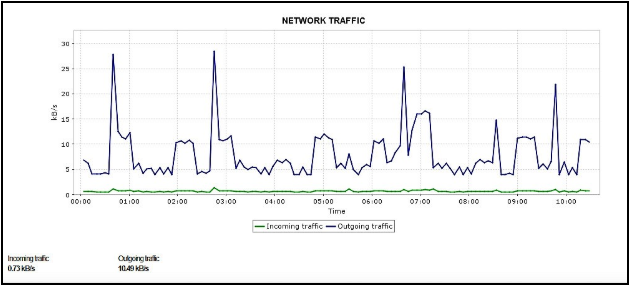
Network traffic is highly dependent on expected throughput. Maintain the expected throughput for your network by keeping track of critical network traffic metrics like Received throughput and Transmit throughput. Like CPU, memory, and storage, each instance needs to have a certain amount of network bandwidth dedicated to it.
The amount of network bandwidth allocated to your DB instance is determined by the instance size. Smaller instances have low bandwidth, whereas bigger instances have more.
Disk IOPS
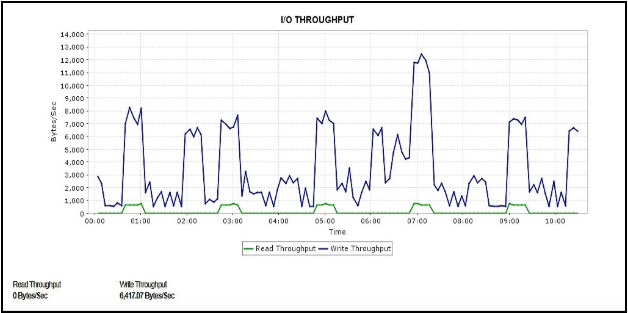
Capture query latencies to measure how long your input/output (I/O) operations take at the disk level. To maintain expected values for input/output operations per second (IOPS), set up a baseline value, and investigate if the results vary from it.
Read IOPS: Sudden spikes in read IOPS might indicate runaway queries.
Write IOPS: Sudden spikes in write IOPS might indicate large data modification.
Keep your storage volumes in pace with the volume of read and write requests by tracking the I/O operations queue. To minimize read and write operations and optimize your applications’ performance, ensure that your typical working set fits into the allocated memory.
Latency
Measuring latency can help you identify and investigate resource constraints affecting DB performance. Monitor latency in transactions for slow reads or writes of any application running in your RDS environment.
Aurora DB
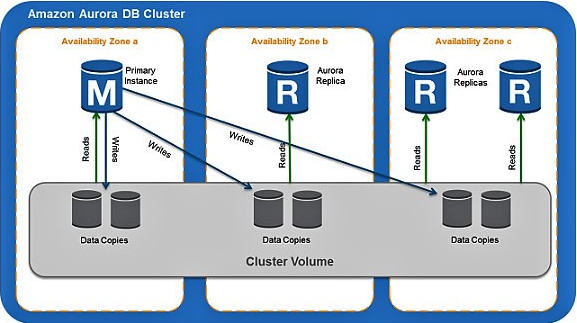
Amazon Aurora consists of one or more primary DB instances and allows you to distribute up to 15 Aurora replicas across multiple availability zones of a DB cluster. It supports read-only queries. You can manage data volumes for the primary instances and Aurora replicas using a common cluster volume. As the cluster volume is shared by all instances of your DB, it’s easy to replicate data for each Aurora replica.
The replicas are assigned three separate endpoints:
-
Cluster endpoint: Connects to the primary DB instance for that DB cluster.
-
Reader endpoint: Connects to one of the available Aurora replicas for that DB cluster. The cluster and reader endpoints provide support for high-availability scenarios.
-
Instance endpoint: Connects to a specific DB instance within an Aurora cluster. Each DB instance in a DB cluster, regardless of instance type, has its own unique instance endpoint.
Read replica metrics
Aurora replicas work perfectly for read scaling, as they are fully dedicated to read operations on cluster volumes. High lag values indicate that read operations from the replica are not serving the current data.
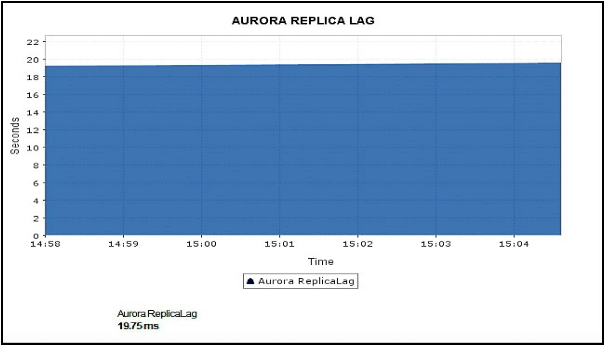
Write operations are managed by the primary instance. Once data is written into Aurora, Aurora writes that data into all data copies. After the primary written instance update is done, Aurora replicas return the same data for query results with minimal replica lag < 100 milliseconds. Replica lag varies depending on the rate of the DB change. A large amount of write operations may cause an increase in replica lag.
If the primary instance fails, an Aurora replica is promoted as a primary instance to maintain high availability. In cases where you encounter failover and Aurora replicas are absent, your DB cluster will be unavailable for however long it takes the DB instance to recover from the failure event.
Volume IOPS
This metric measures the average amount of read or write operations from the cluster volume every five minutes. By default, the value of VolumeReadIOPS should be small and stable. If you witness any unusual spikes in your read IO, investigate your DB instances to identify the cause behind it.
Buffer cache hit ratio
This term refers to the percentage of queries served by the data already stored in memory. With this metric, you gain deep insight into the amount of data being served from memory. A high buffer cache hit ratio indicates that queries don’t have to access the disk to fetch data. A low buffer value indicates that the queries in the DB instance are going to the disk more often than not.
Query performance and throughput
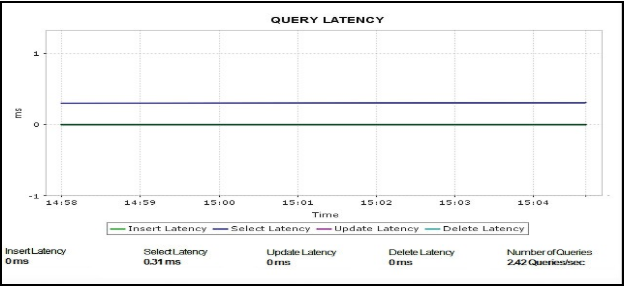
Understand DB operations by tracking query throughput. Capture a critical measure of query performance, irrespective of whether the query is served from the query cache, by measuring data definition language (DDL) throughput and latency for all DDL requests. Avoid performance bottlenecks by setting up alerts when sudden changes in the query volume occur.
Applications Manager is an AWS monitoring tool that can effectively monitor all the metrics mentioned in this blog and much more. Get started with a free, 30-day trial today.