Key metrics for Elasticsearch performance monitoring

Elasticsearch is a highly scalable, distributed, open-source RESTful search and analytics engine that offers log analytics, real-time application monitoring, click stream analytics, and more. Elasticsearch stores and retrieves data structures in real time. It has multi-tenant capabilities with an HTTP web interface, presents data in the form of structured JSON documents, makes full-text search accessible via RESTful API, and maintains web clients for languages like PHP, Ruby, .Net, and Java.
The only way to fully take advantage of these capabilities is by using Elasticsearch monitoring tools that give you deep visibility into your Elasticsearch environment. The right Elasticsearch monitoring tools can turn data into actionable insights. Monitoring the performance of your Elasticsearch environment with the latest aggregated data helps you stay up-to-date on the internal components of your working cluster. When it comes to Elasticsearch monitoring, there are tons of metrics to consider—here, we'll take a closer look at four important metrics you should keep on your radar.
Key Elasticsearch performance metrics to monitor:
1. Cluster health and node availability
The performance of an Elasticsearch server strongly depends on the machine it's installed in. To stay on top of your cluster health, it's critical to monitor key performance metrics like disk I/O, CPU usage for all nodes, memory usage, and node health (in real time) for each Elasticsearch node. It's best to look into Java Virtual Machine (JVM) metrics when CPU spikes arise. As Elasticsearch runs inside JVM, monitoring Elasticsearch memory usage requires you to check JVM memory and garbage collection stats.
2. Index performance metric

While running indexing benchmarks, a fixed number of records are used to calculate the indexing rate. When the workload is write-heavy, updating indices with new information makes monitoring and analyzing Elasticsearch performance easier. Sudden spikes and dips in indexing rates could indicate issues with data sources. The overall cluster performance can be affected by refresh time and merge time.
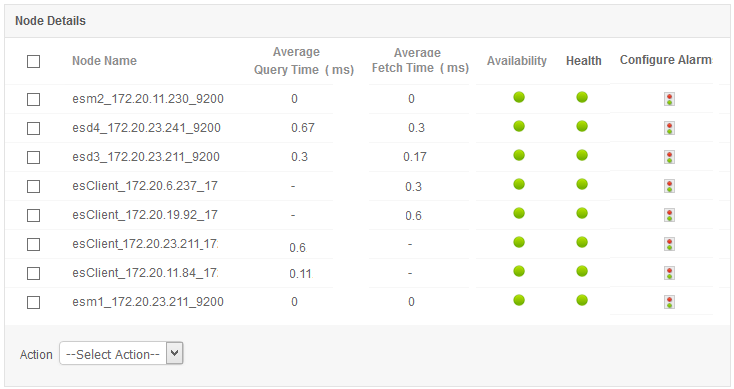
Reduced refresh times and quick merge times are usually preferred. Optimal Elasticsearch performance monitoring tools will help you monitor the average query latency for every node including start time, average segment time in node, file system cache usage, and request rates as well as help you configure actions if thresholds are violated.
3. Search performance metric
Apart from index requests, another important request is the search request. Here are some important search performance metrics to consider while performing Elasticsearch monitoring:
Query latency and request rate: There are numerous things that can affect your query performance such as poorly constructed queries, improperly configured Elasticsearch clusters, JVM memory, garbage collection issues, etc. Without a doubt, query latency is a metric that has a direct impact on users, and it's essential that you receive alerts when there's an anomaly. Tracking the request rate along with query latency provides an overview of how much a system is used.
Filter cache: Filters in Elasticsearch are cached by default. While executing a query with a filter, Elasticsearch will find documents matching the filter and build a structure called a bitset using that information. If subsequent query executions have the same filter, then the information stored in the bitset will be reused, making the query execution faster by saving I/O operations and CPU cycles.
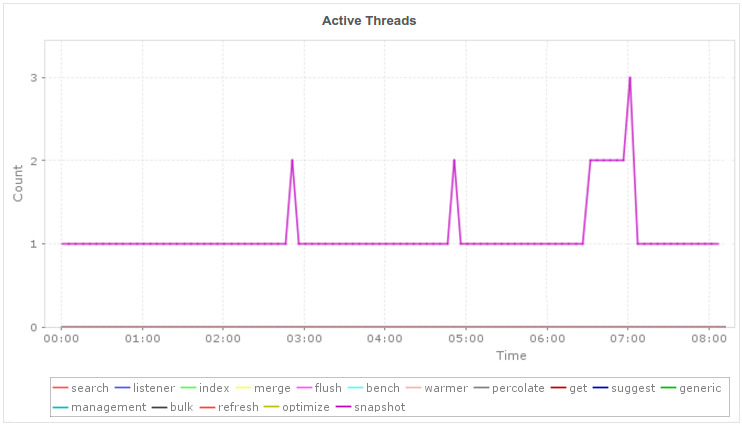
Elasticsearch nodes use thread pools to manage thread memory and CPU consumption. Thread pools are automatically configured based on the number of processors. Important thread pools to monitor include: search, index, merge, and bulk. Thread pool issues can be caused by a large number of pending requests or a single slow node as well as a thread pool rejection. A drastic change in memory usage or long garbage collection may indicate a critical situation.
Too much garbage collection activity can happen for two reasons:
One particular pool is stressed.
The JVM needs more memory than what has been allocated to it.
To avoid spikes in your thread pool, be prepared for thread pool issues that were caused due to pending requests, a single slow node, or thread pool rejections on your indexing queue.
ManageEngine Applications Manager makes Elasticsearch monitoring easy by offering out-of-the-box monitoring for your Elasticsearch server with in-depth insights that easily identify problematic nodes with root cause analysis of performance issues. Try a free, 30-day trial of Applications Manager to evaluate your monitoring requirements now!