The top 5 VM metrics that every Azure admin should monitor

The age-old approach of storing data on self-hosted data centers is rapidly becoming obsolete, with most organizations shifting towards cloud solutions like Microsoft Azure. Azure delivers more than 600 services like on-demand computing, storage, data management, and networking, and virtual machines (VMs) are an important component of the Azure cloud platform. Azure VMs provide the flexibility that organizations need to build virtual networks for a wide variety of computing solutions and deliver services to a global audience.
Challenges with Azure VM monitoring
Monitoring the performance metrics of Azure VMs comes with its own set of challenges. When it comes to Azure VMs, the top two challenges faced by IT admins are:
Unplanned system downtime: System downtime is a nightmare for any organization. Applications Manager, our application performance monitoring software, can proactively alert you about critical conditions and help you take corrective actions.
- Lack of performance visibility: For efficient application performance, it is essential to monitor metrics such as CPU utilization, interrupt time, privileged time, and available bytes to isolate and troubleshoot problems before end users are impacted.
Monitor metrics effectively with Applications Manager
Monitoring the performance metrics of Azure VMs keeps you alerted in case of any drastic change in system performance. While monitoring critical metrics, setting thresholds is vital; that way, you can make sure metrics aren't overutilized. Below are the top five VM metrics that you need to be tracking, along with their recommended threshold values.
1. CPU utilization
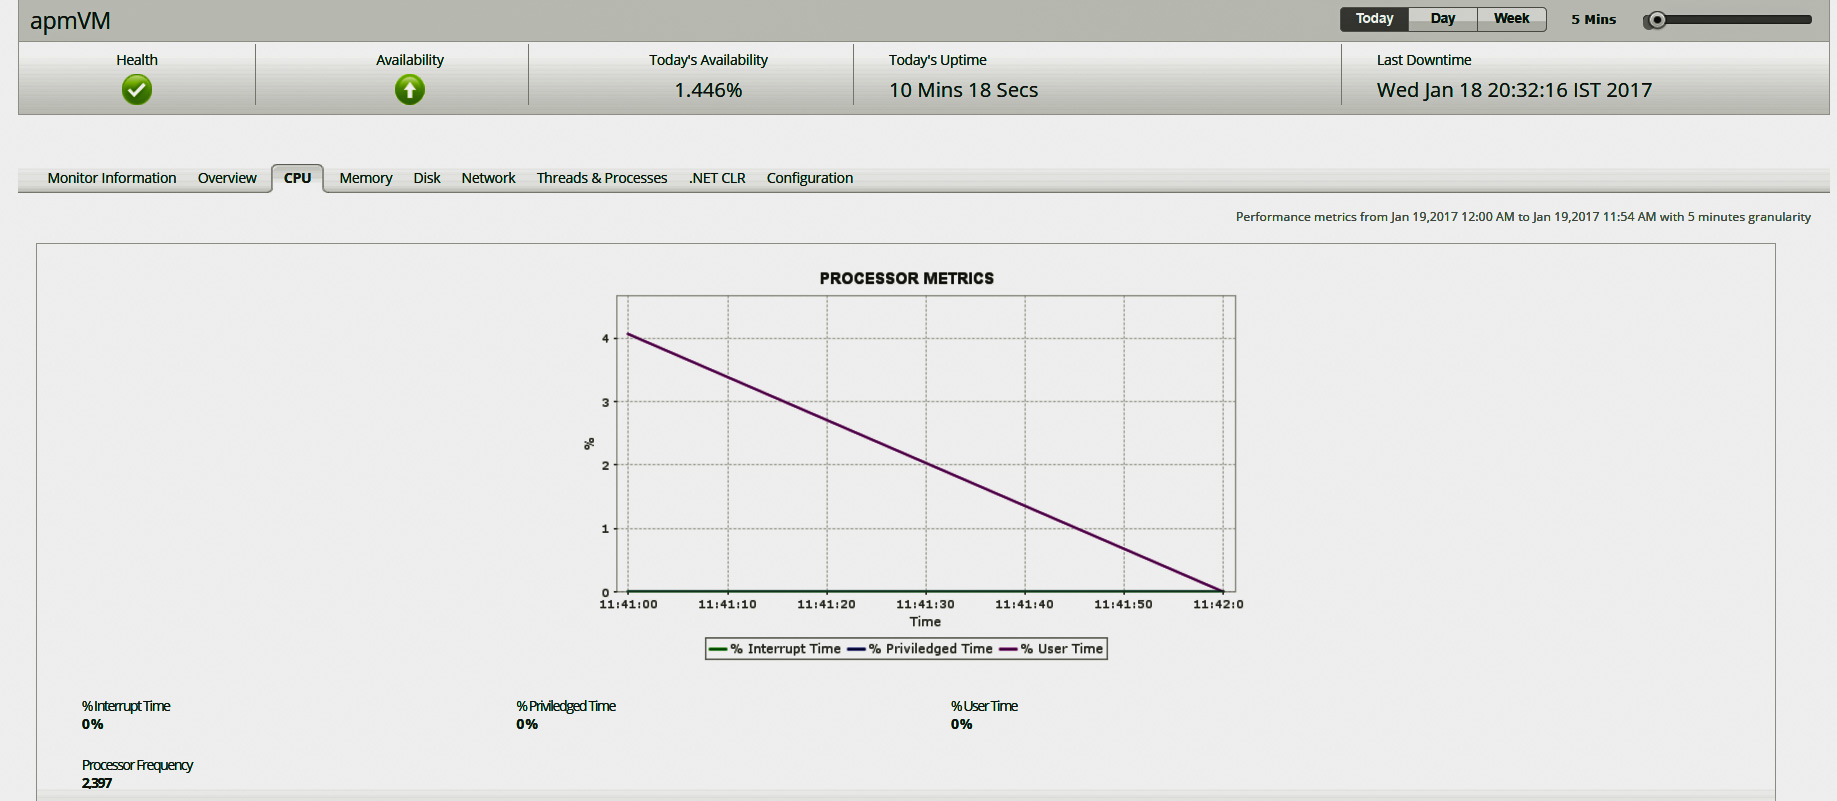
CPU utilization refers to the amount of work handled by a CPU. High CPU utilization over an extended period of time will shorten the lifespan on your VMs.
Recommended threshold: 60-70% (if all Azure VM features are enabled)
Resolution: Check for any active CPU-demanding apps, idle processes, and whether too many background processes are running.
2. Interrupt time
Interrupt time is the percentage of processor time spent on handling interrupts. A high interrupt time in the processor could indicate a hardware or driver problem.
Recommended threshold: 30-50%
Resolution: Check the device drivers or adapters that often cause high interrupt time.
3. Privileged time
Privileged time is the percentage of time the processor was busy with kernel mode operations. A high privileged time in the processor could indicate a hardware or driver problem.
Recommended threshold: 30-40%
Resolution: Faulty system drivers or antivirus software can cause high privileged time. Check and troubleshoot those faulty system drivers.
4. Available bytes
Available bytes is the amount of physical memory immediately available for allocation to a process or for system use. If available memory is consistently low (2MB or less), the computer will become unresponsive because it will be occupied exclusively with disk I/O operations.
Recommended threshold: 1-5%
Resolution: Notice which processes are running as well as the sizes of their working sets as you monitor memory counters. The processes might need to be updated or replaced if they are contributing to memory shortages and you do not want to acquire additional memory. 5. Percent committed bytes in use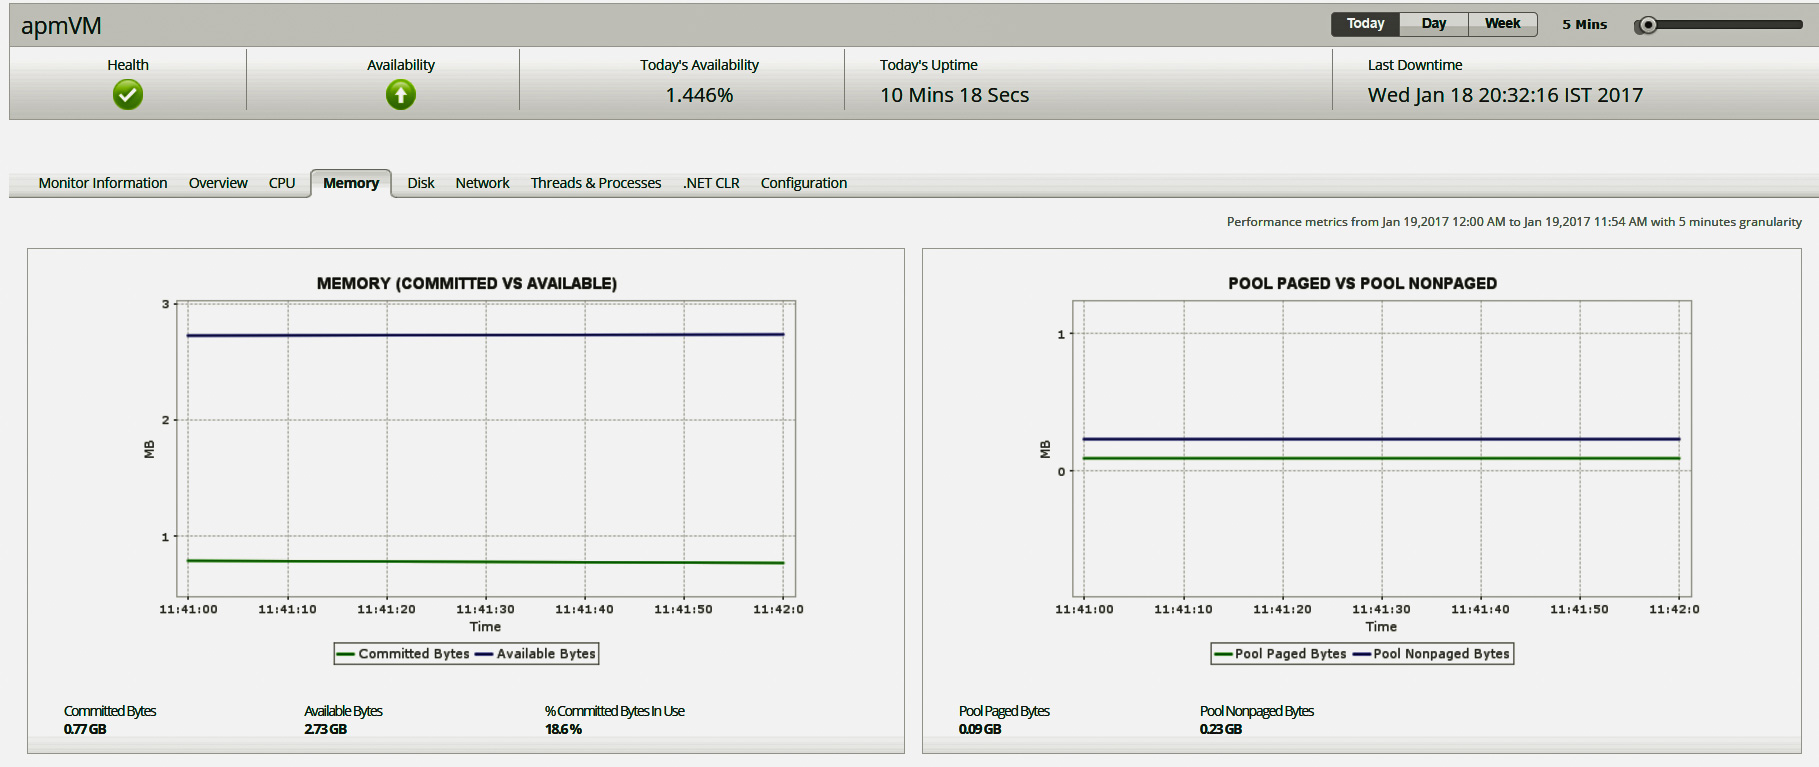
Percent committed bytes in use is the amount the page file is used; it's calculated based on (memory / committed bytes) : (memory / commit limit). Committed bytes is the amount of committed virtual memory, and the commit limit is determined by the size of the paging file. If the percent of committed bytes in use is high, overall system performance may significantly diminish and lead to poor operating system and application performance.
Recommended threshold: 80%
Resolution: Close or stop one or more applications, services, and processes.
Add additional physical memory to the computer. Move applications to one or more additional computers.
Apart from these metrics, you can monitor hundreds of other performance metrics with Applications Manager. Best of all, Applications Manager will notify you instantly when any metric violates its threshold. Learn more.
Also, we are now providing support for Azure SQL DB. Check out the new feature.
Hello, in linux VMs is the value "Available bytes" including cache as Available?