Until 2012, NetFlow Analyzer’s Enterprise edition benefited ISPs, MSPs, and large organizations that had distributed network architecture, helping them monitor their bandwidth.
Any organization with less than 600 interfaces that wants to monitor all of them by installing a product in their headquarters’ data center can go with the Professional or Professional Plus editions of NetFlow Analyzer, which have integrated collectors and a reporting engine that collects the data and generates reports.
The Enterprise edition was mainly used by organizations that had a distributed architecture, and monitoring was done by means of a central server and multiple collectors across different sites in the same network.
Limitations of the Enterprise edition
- Some features of the Professional or Professional Plus editions are unavailable due to architecture-based differences.
- Bandwidth issues can arise when transporting data from collectors to the central server.
What the new Distributed edition solves
We have introduced our new distributed architecture, which is an enhanced version with similar architecture to the Enterprise edition that was available earlier. A difference is that the Distributed edition has collectors that collect the data and store it in the product’s local database.
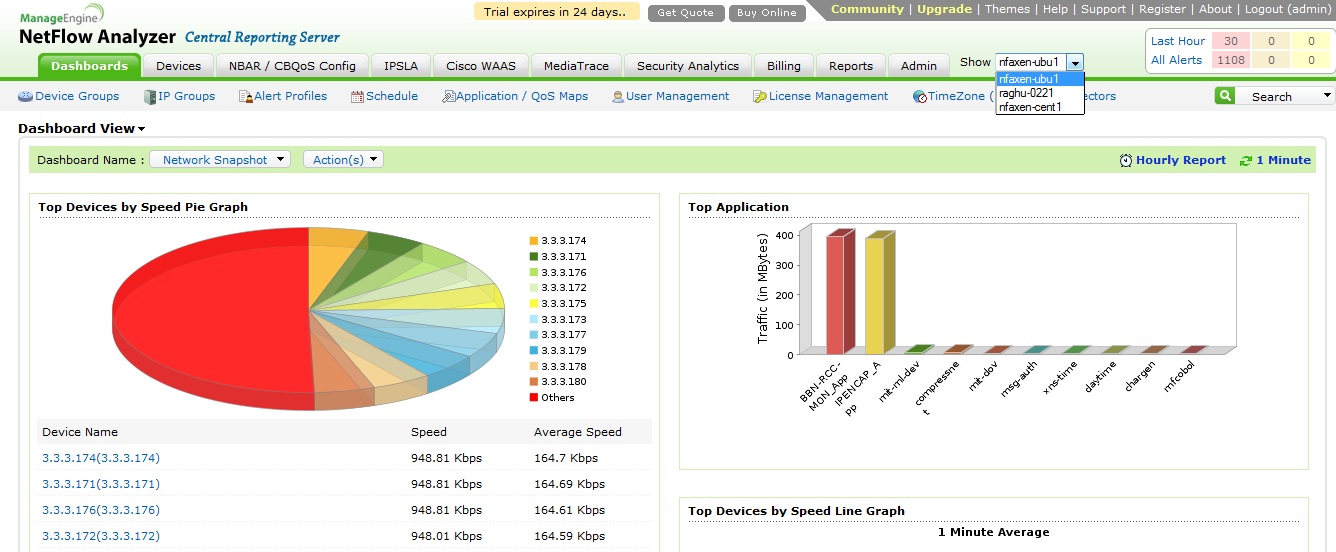
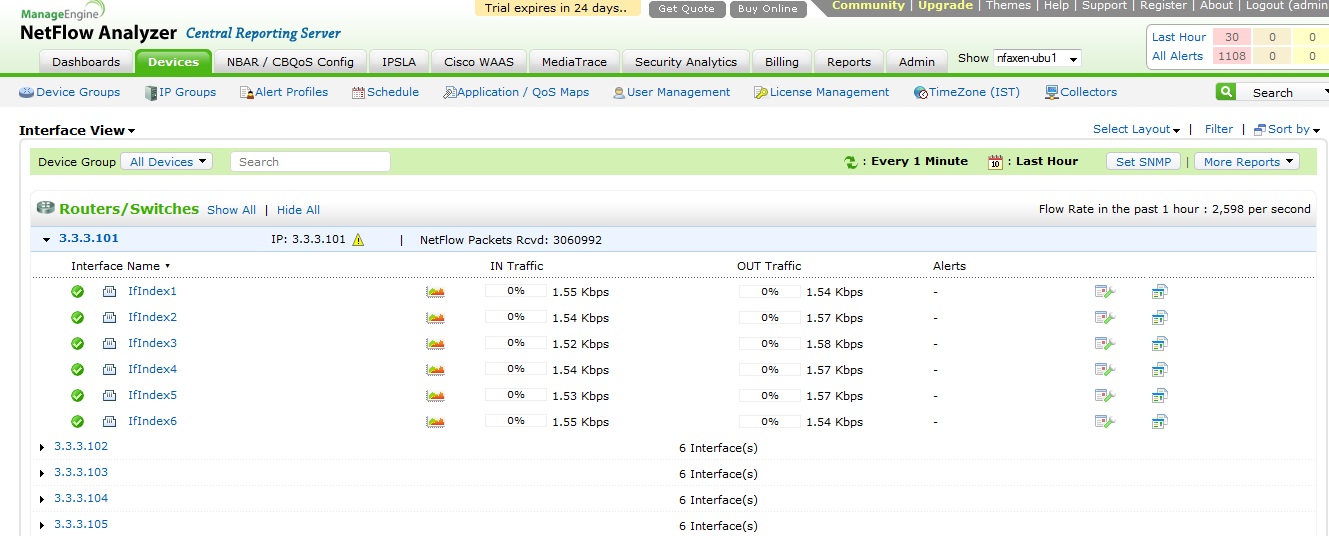
The central reporting server communicates with collectors and integrates all the collectors in one single UI, and management of all the collectors can be done from the central reporting server UI—that is scheduled report creation, alert configuration, IP groups, device groups, IP SLA, etc.
Advantages of the Distributed edition
- Since the collector stores all the collected data in its local database, the bandwidth utilized between the central server and collector is much lower.
- Scalability is very high.
- All the features of the Professional and Professional Plus editions are available.
- There is a single installable file for collectors and the central server. The user has the option to select which one to install during the installation.
Architecture
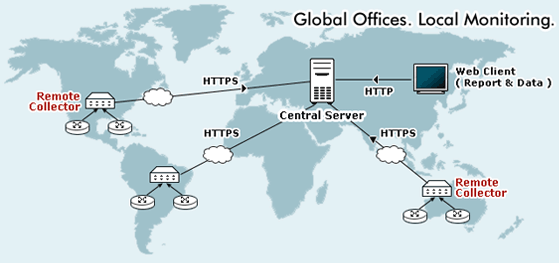
The Distributed edition architecture is as shown in this diagram:
Central reporting server
The central reporting server has to be deployed first, and it acts as a global console in the Distributed edition, reporting on all the devices from collectors and generating reports. It can also be called the management server, where one can administer all the collectors from the central reporting server itself.
The administrator can create users (guests and operators) in the central server with their respective time zone and grant them access to device groups, IP groups, interface groups, etc.
Collector server
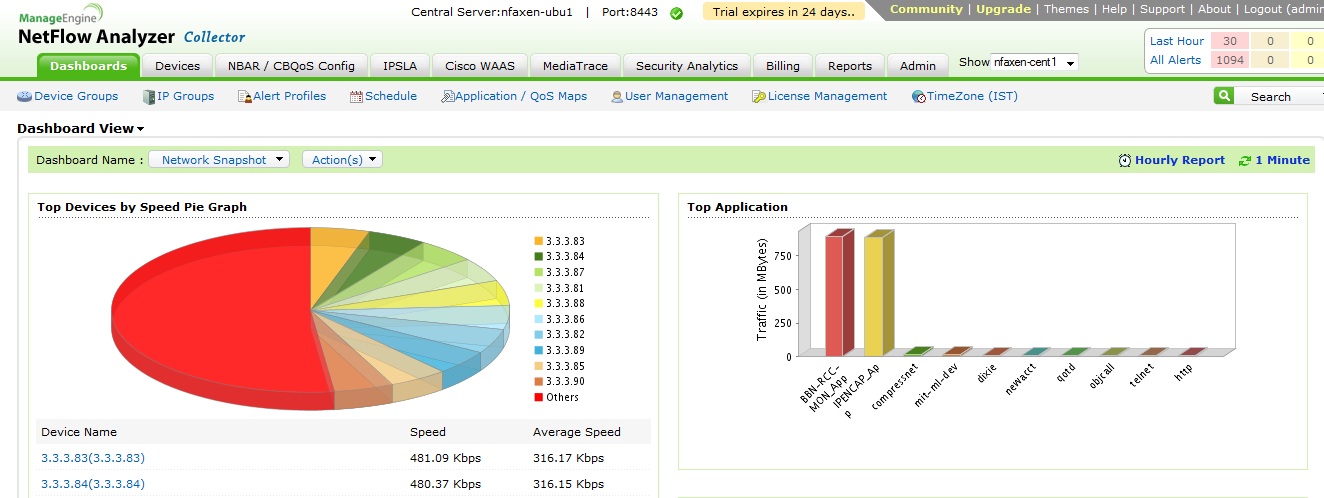
The collector server has to be deployed after the central reporting server is installed and started. The collector uses an HTTPS connection to contact the central reporting server. During the installation of the collector, we have to specify the central server IP and HTTPS port on which the central server is running so the collector communicates automatically with the central reporting server once it is installed and started.
The user can generate reports in the collector UI. They can also create users (guests and operators) with respective time zones and assign them access to device groups, IP groups, interface groups, etc.
Here on the NetFlow Analyzer team, we are always thinking of improvements for product feature architecture, and we expect this Distributed edition can solve many ISPs’, MSPs’, and corporations’ needs for bandwidth monitoring with its high-end feature list and scalability.
Click here to learn which features are available with the Distributed edition, and click Download to install the product on your network to evaluate its capability.


Is the processing such as anomaly detection also done at the remote collector nodes? or is that done at the central collector server?
HI
Is there any chance to export Source and Destination Mac-addresses to the Netflow analyzer?