After configuring Cisco devices for Medianet exports(as mentioned in the previous blog), the next step is generating Medianet reports in NetFlow Analyzer. The Medianet report in NetFlow Analyzer shows traffic IN and traffic OUT details based on media volume, round trip time, packet loss and jitter.
The user can also generate report for each of these metrics separately. To generate report for Medianet, Drill down to each interface of the router in NetFlow Analyzer for which Medianet export is configured, then you can click on Medianet Tab to generate report based on the desired parameter.
Cisco Medianet Reports in NetFlow Analyzer:
The Medianet Reports can be generated for Source, Destination and Applications contributing to media traffic in the network or at a particular interface. The reports can be generated for following parameters individually.
-
Media Volume
-
RTT
-
Jitter Average
-
Packet Loss
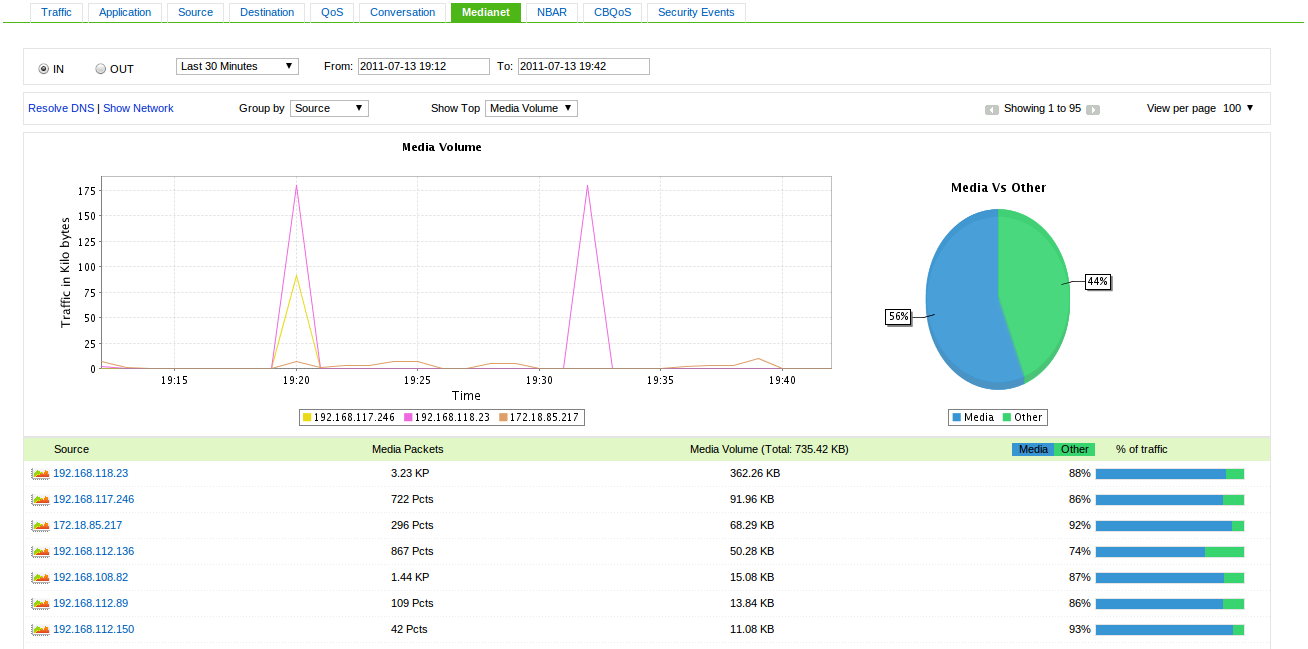
Media Volume :-
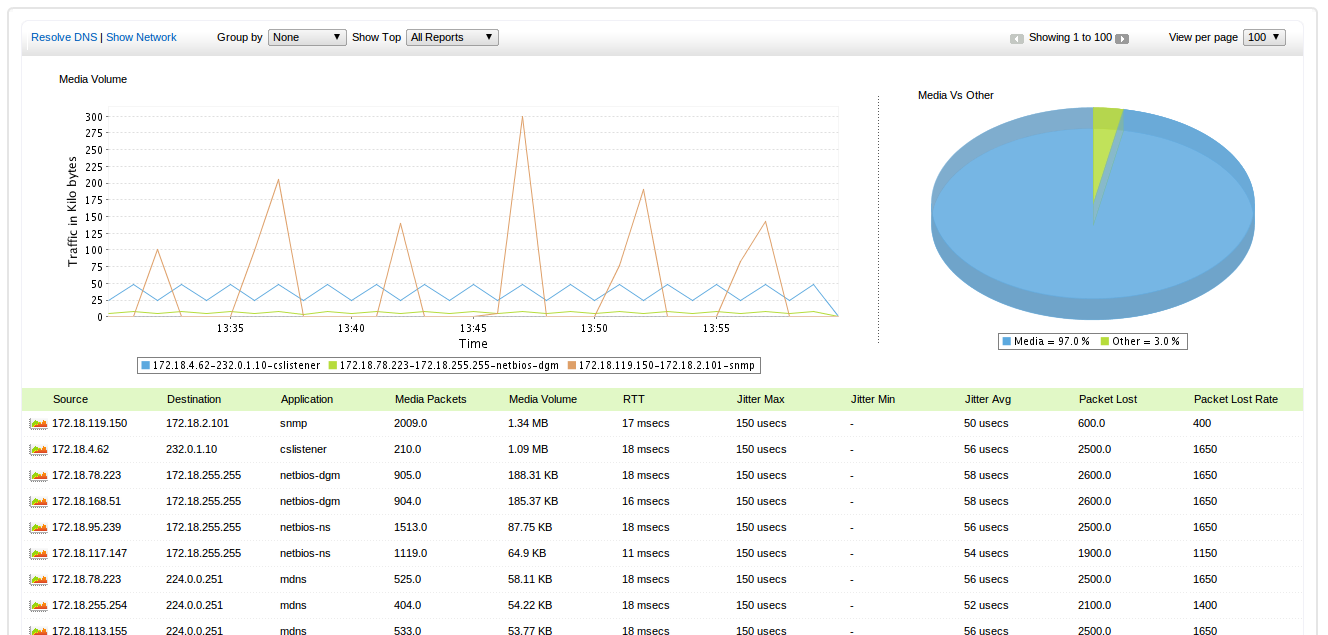
The time-line graph gives quick view of the top 3 contributors(IP address) of media traffic. The pie chart represents the percentage of rich media traffic to other traffic in the network.
Below the time-line graph, you can view source/destination/application that has sent/received maximum number of media packets and volume of media traffic in the network. It also reports the percentage of media traffic when compared to general traffic.
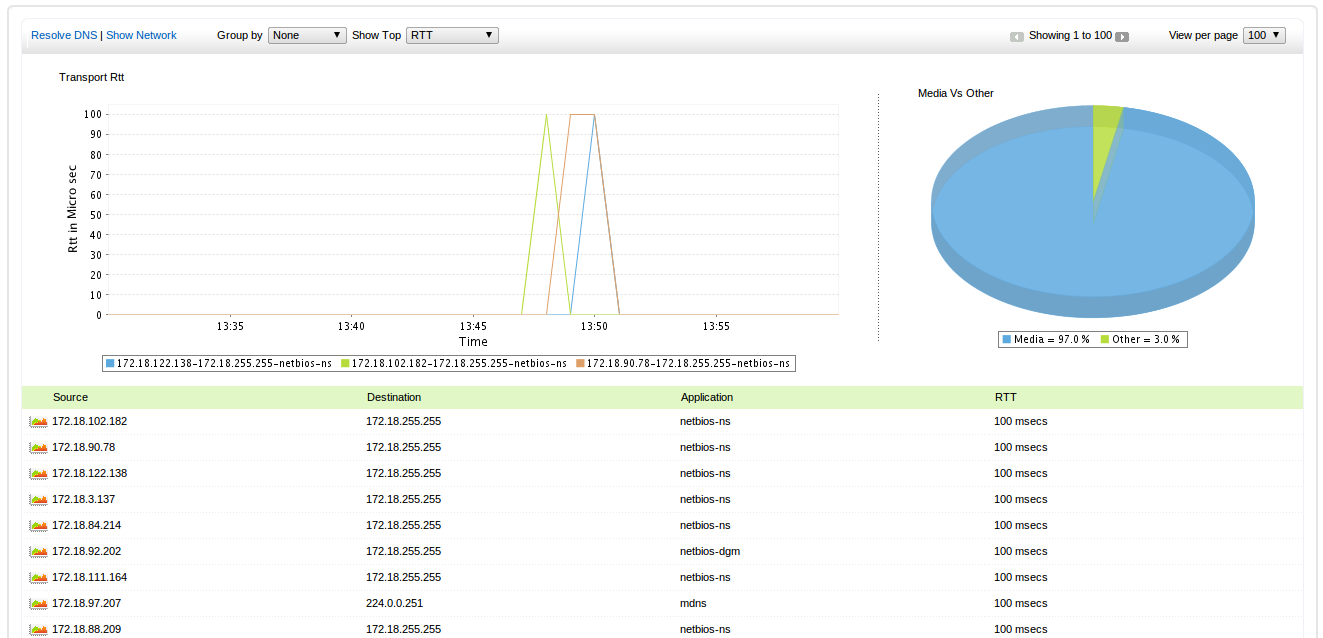
RTT:-
The graph for RTT shows the Top 3 IP addresses with high Round-Trip-Time. You can also see the RTT value for each Source/Destination/Application.
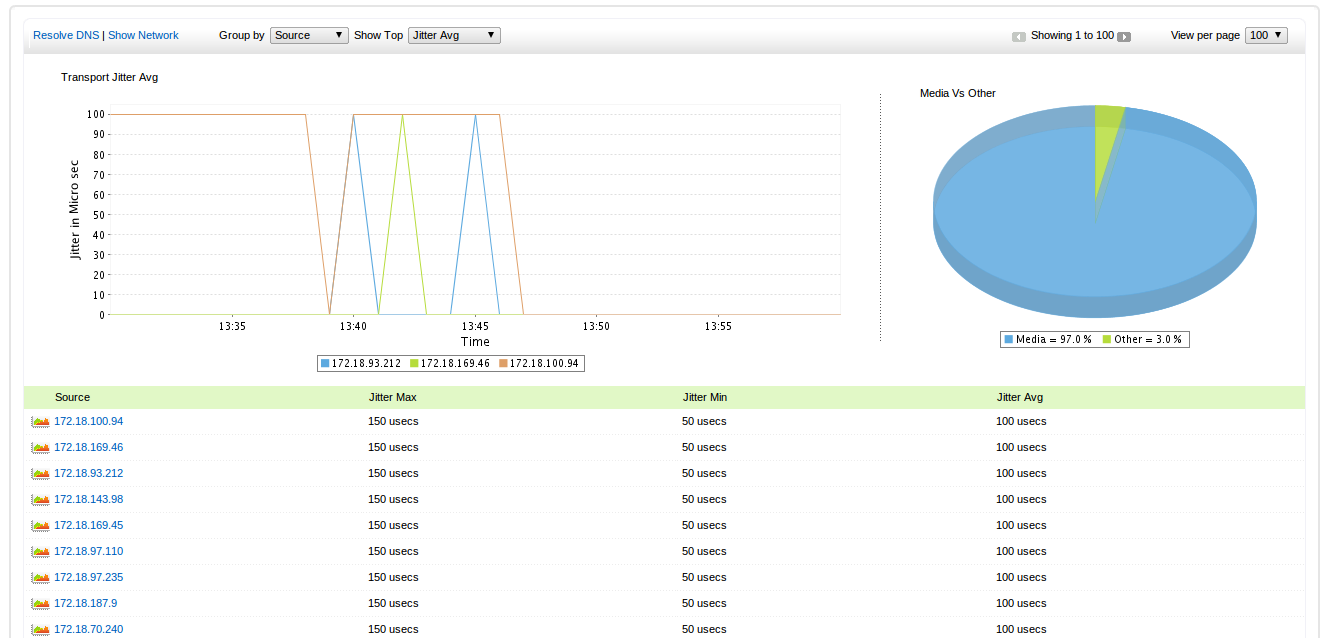
Jitter :-
The graph for jitter shows the Top 3 IP addresses with transport jitter average. You can also see the Jitter Average value for each Source/Destination/Application.
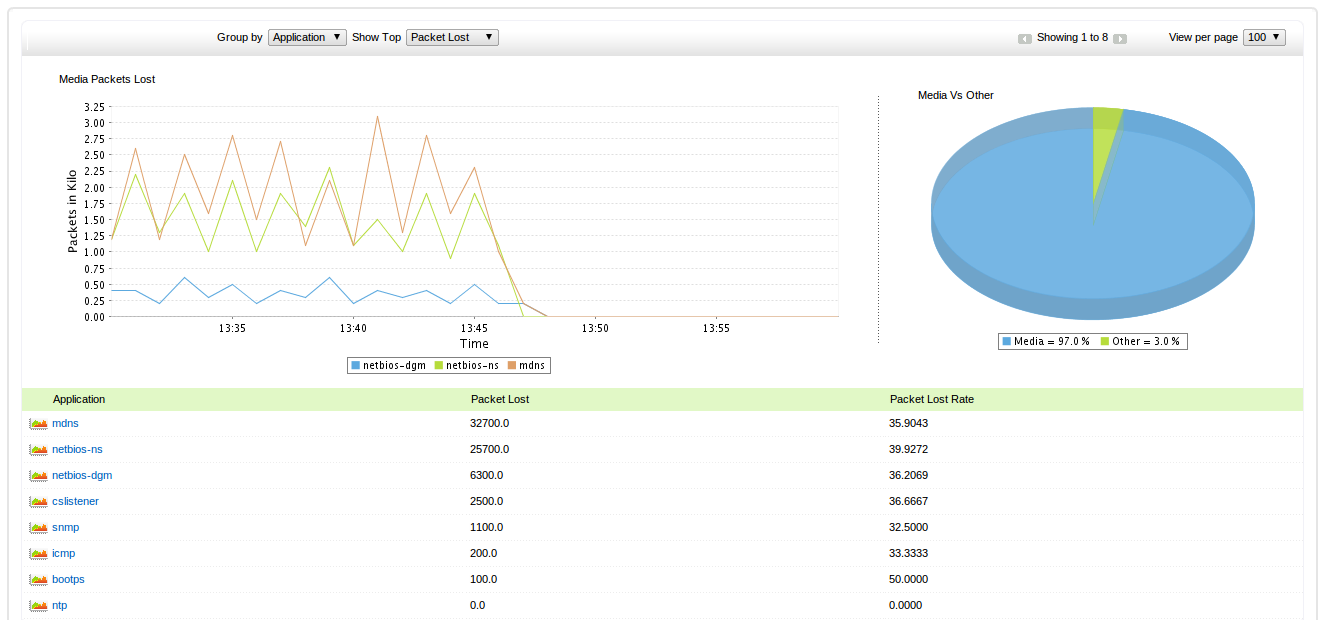
Packet Loss :-
The graph for packets loss shows the top 3 IP addresses with high packet loss. You can also see the packet loss value for each Source/Destination/Application.
Apart from the above reports, NetFlow Analyzer can generate two reports which include all the above mentioned parameter in one single view.
All Reports:-
It displays the source/destination/application that has sent/received maximum number of media packets, the volume of media traffic, maximum, minimum, and average jitter values, number of packets lost, the rate of packet loss. Clicking on the respective source/destination/application will open the detailed reports page that lists the traffic details of the source/destination/application selected.
Detail Report:-
Clicking one single IP Address or Application in Medianet report takes you to page where it displays Media Volume graph is a bar-graph that details on the volume of media traffic sent/received by a specific resource during the selected time period. It also shows the RTT and Jitter average of the resource selected in the given time period. The table below the graph lists the Source, Destination, Application, Media Packets, Media Volume, RTT, Jitter Max, Jitter Min, Jitter Average, Packet Lost, Packet Lost Rate of the resource.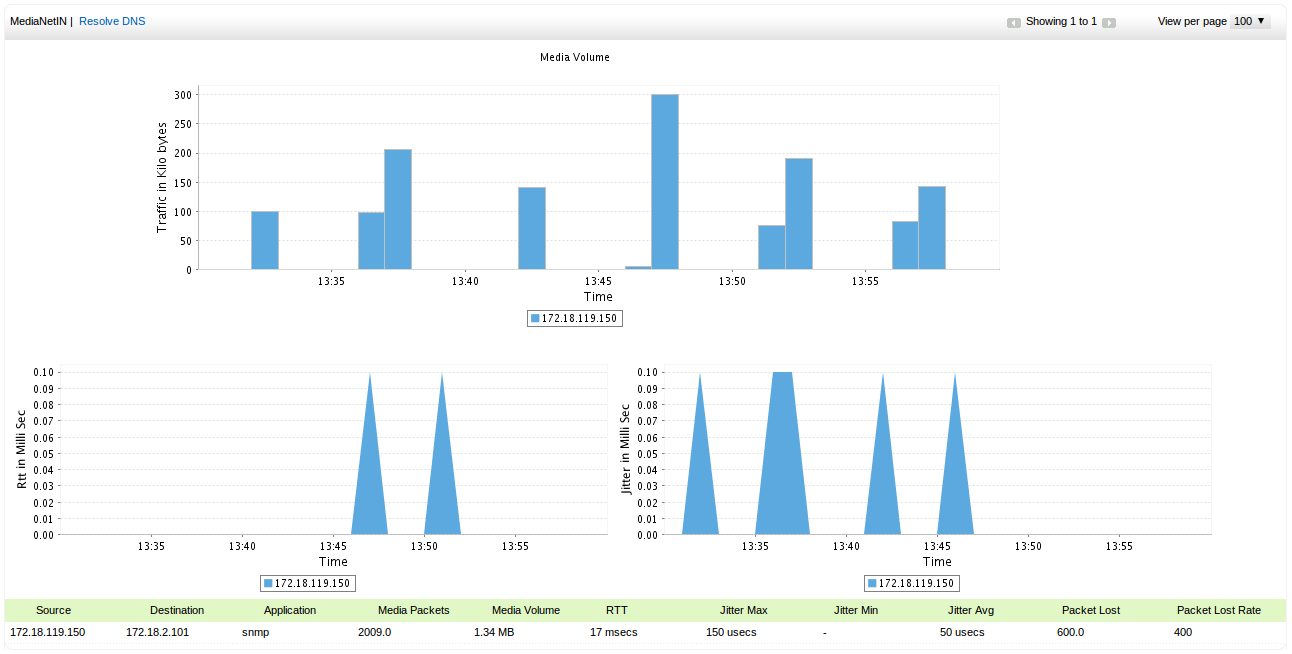
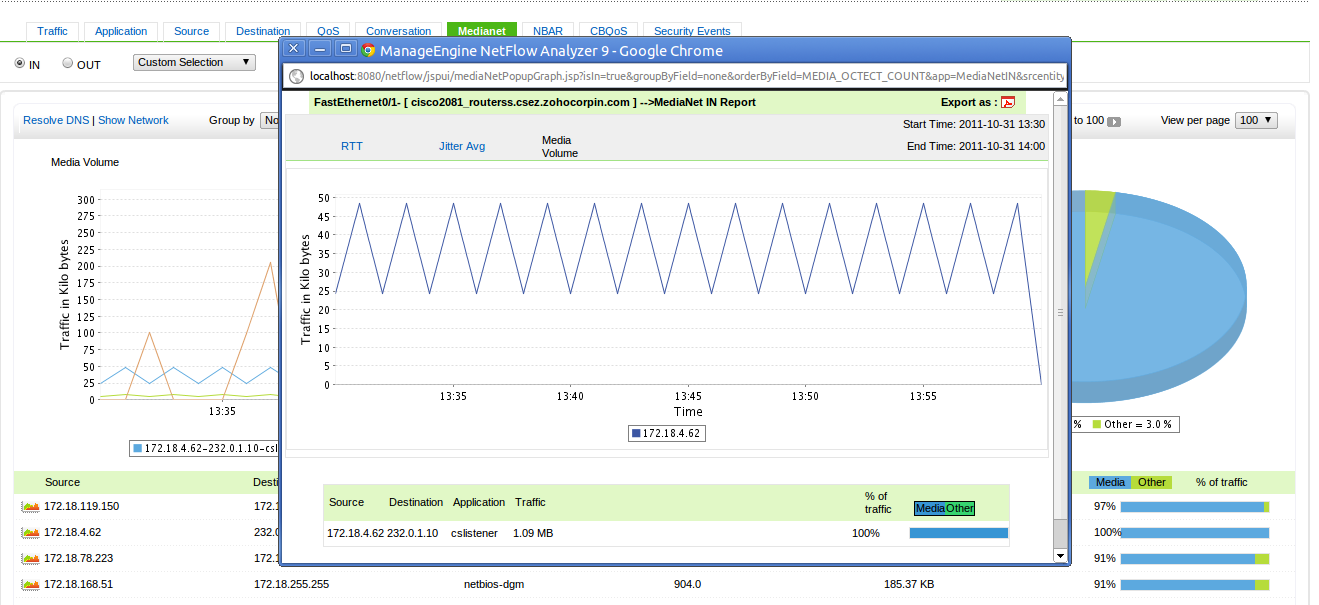
Thus NetFlow Analyzer as a Bandwidth Reporting and Media Performance monitoring tool provides very useful insights into the performance of your network that consists of an ever-growing category of video traffic.
For 30 Day Trial, click Download now.
Thanks and Regards
Praveen Kumar


Pingback: Network Performance Analysis using Cisco IP SLA VO