You must have gone through the variety of features that are available on NetFlow Analyzer 8.6 including capacity planning reports. In this blog, we will discuss on a feature that saves a lot time in generating reports. The feature is called Report Profile.
What is it?
Automation and Customization are the two words which plays a vital role in any world. We have seen Schedule of reports in NetFlow Analyzer which gives the ability to get automated reports on a daily, weekly or Monthly basis through email and also can be viewed from GUI. The schedule reports provide automation but cannot be customized as they use pre-defined templates which are based on the default reporting parameters in NetFlow Analyzer like traffic reports, consolidated reports, application report, conversation reports, etc.
Report Profile is the feature we brought into the product to provide customization on the reporting front with the user not having to recreate his custom searches the next time. Instead of having to create your customer search criteria each time through ‘Troubleshoot’ or ‘Search’ reports, this lets you create a customized report by setting up a appropriate filters and see immediate reports. The profiles are saved and does not require to be recreated the next time.
Advantages of Report Profile:
The Advantage of having a Report Profile is below:
1. Saves the valuable time by not having to manually generating reports.
2. Provides a high level of customization.
3. Quickest way to get reports on the most important criteria. After having created a profile, a click is all that you need to do to see the report.
Lets get into a scenario in which a user has to monitor http and https traffic usage on a monthly basis for WAN interface. Users can either drill down on the specific WAN interface and look at the application list, again drill down on the specific applications and generate a report or can go to ‘Troubleshoot’ or ‘Search’ reports and search based on criteria.
The above involves manual work and takes time. Report Profile is more handy here. It just needs a one time configuration and can see all the reports like Application, Source, Destination and Conversation with filters to associate application, source IP, destination IP, DSCP, protocol and etc. If the more than 4 reports are selected while configuring Report Profile, report will be generated with Tabbed View else it is Widget View.
How to Create Report Profile:
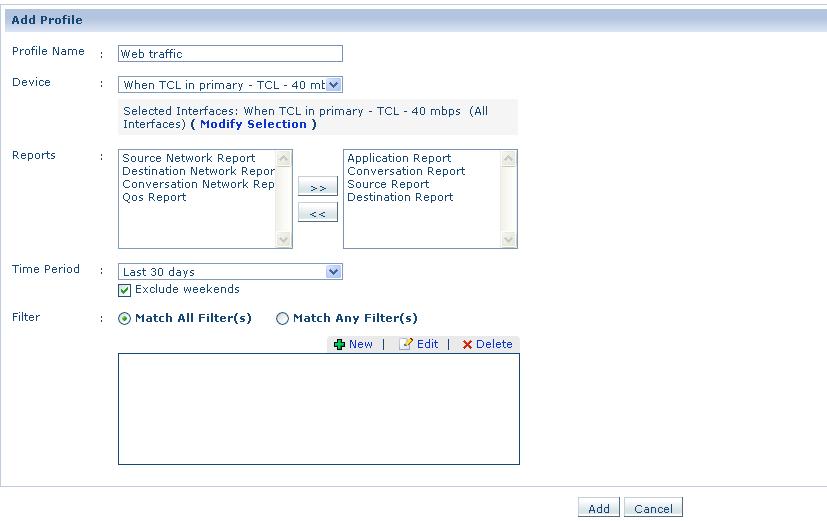
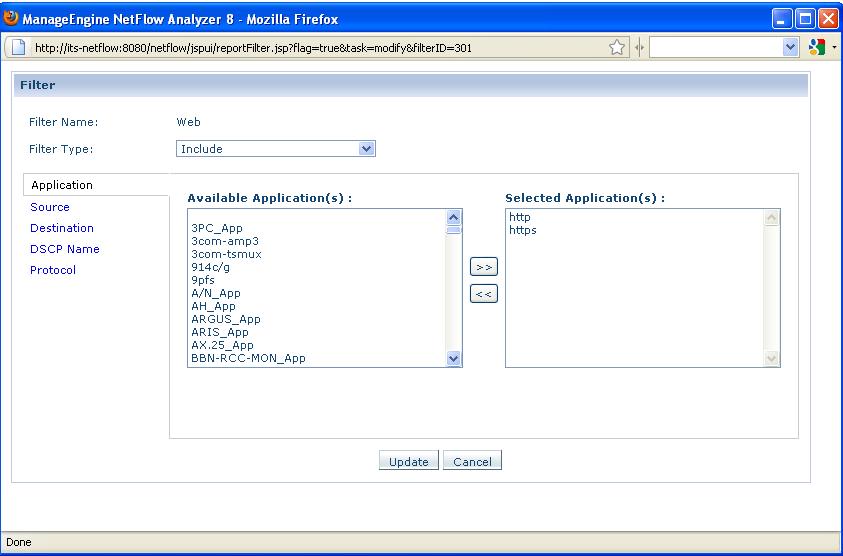
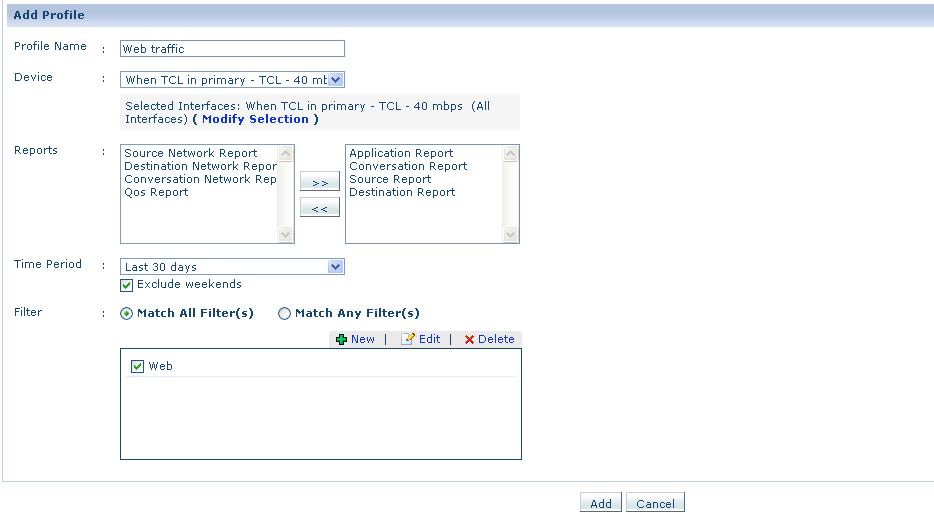
At the left hand side panel in the product UI, you will find option called Report Profile where you can add new profile by clicking on Add Profile. When you click on Add Profile, you will be prompted to enter Profile name, Description, Device Selection, Time period then select the reports that you want to view. Next step is to create report filter for customizing the report as per the requirement. On the Report Filter, you can filter the report by Application, Source, Destination, DSCP Name and Protocol etc either by Including or Excluding them.
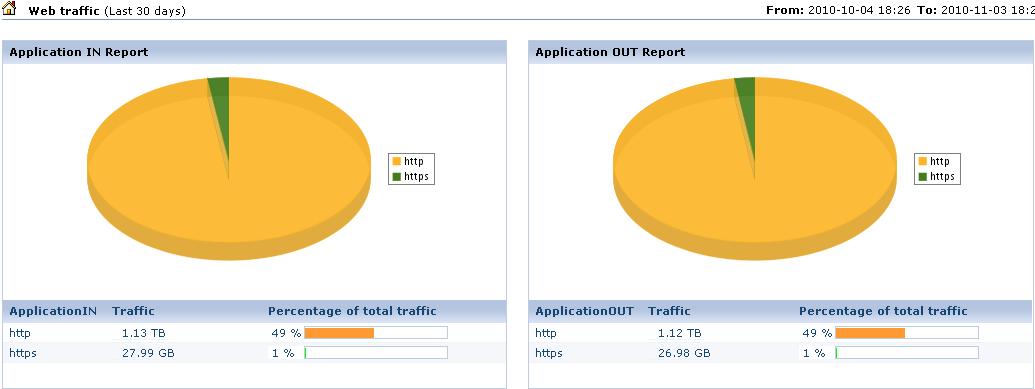
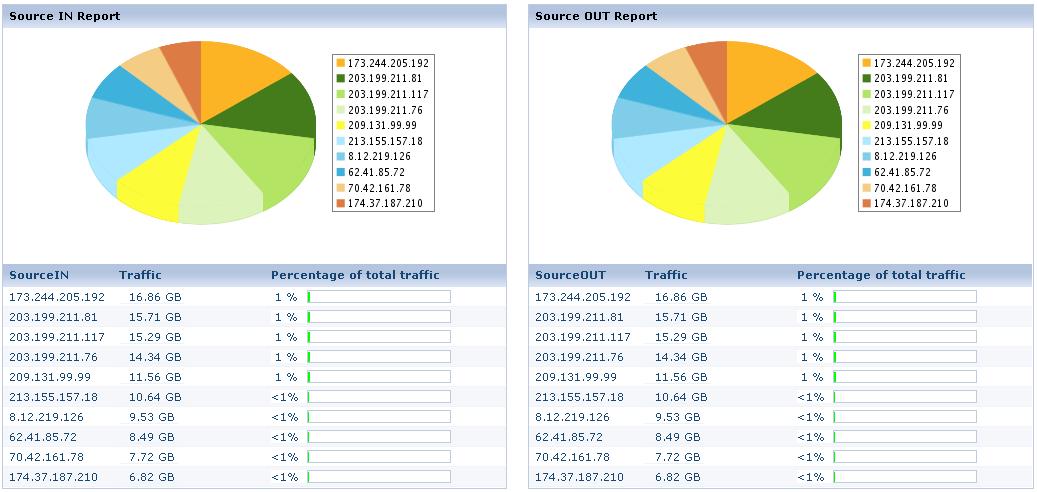
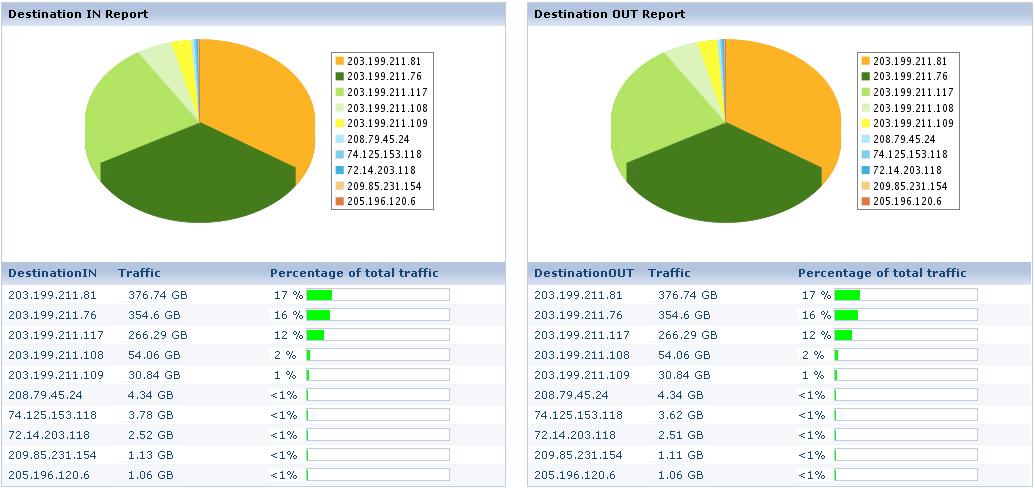
Once the profile has been created, click on it to see immediate results. You can see the graphical reports for the criteria you selected through the report profiling option.
Configuration:
Report :
Let us know your suggestions and comments on report profiles and other features in NetFlow Analyzer.
Demo | Download 30-day Trial | Twitter | Customers
Regards,
Praveen Kumar

