Monitor your geographically distributed VoIP deployment
ManageEngine releases new Distributed Edition of VQManager-version 7.0 which is highly scalable for mid and large Enterprises and Service Providers with geographically distributed locations.
VQManager Distributed Edition is built on a Central – Probe architecture. Central Server provides a centralized console UI to view the data collected periodically from all the sites(probe server installed at individual sites). With this latest release, you can monitor more than ~1000 concurrent calls spread across multiple VLANs in a single location as well as your geographically distributed VoIP network by installing multiple probes.
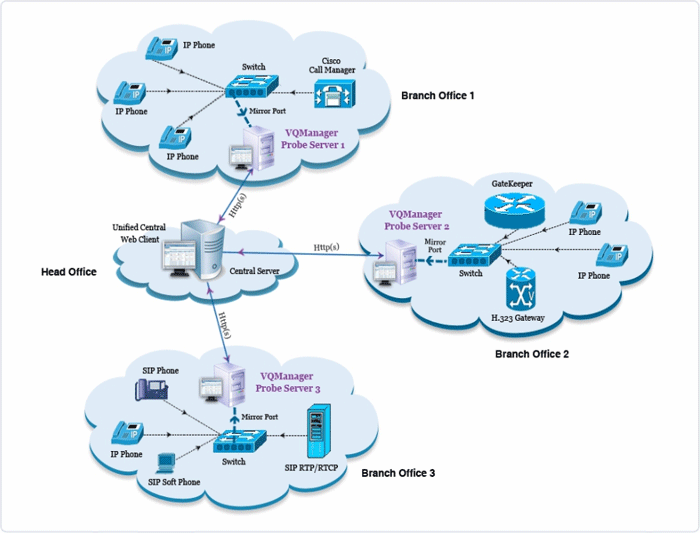
The Central server UI makes it easy to identify and troubleshoot VoIP problems and to provide more insight into your VoIP network. Apart from troubleshooting, VoIP Administrators can also get input on maintaining their VoIP user base and utilize the bandwidth accordingly.
Setting up and Configuring VQManager Distributed Edition:
Central server should be installed and started before starting the Probe server. Once the Central is up and running, If the Probe server is started, it should be registered to the corresponding Central server. The registration process will fail if Central server is not started / not reachable at first place. In such situation, please shutdown the Probe server and start the Central first. If the Central server is running and still registration fails, make sure that Central server is reachable from the Probe server installed machine or check if the Central server details provided to the Probe server are correct. All the network VoIP traffic needs to be port-mirrored to the Probe server to monitor the VoIP calls in that Site.
Once the Probe server is registered to Central server, you have to add sites for each Probe server and associate them. A Site is a logical representation of a group of IP Phones monitored by a single Probe Server. Each Site should be associated with a single Probe Server which monitors that Site and provides data to the Central Server periodically. To see the list of all the registered Probe Servers with the Central Server, go to Admin tab and click the Probe under System Settings.

When the Probe servers are associated with their sites, Center Server dashboard will provide the details of the VoIP calls happening in the associated sites. Here is some introduction to VQManager Central Dashboard.
Call Volume
The Call Volume graph provides us the percentage of distribution of the Successful, Error, Unanswered and Unmonitored calls across all the Sites in a graphical view (left side of the page) and the actual counts of these calls in the tabular view (right side of the page). Clicking on a single site in the bar graph provides an hourly based call volume trend for that site. On further drill down, it will lead to the corresponding Probe details page.Refer the screen-shot shown below.

Voice Quality
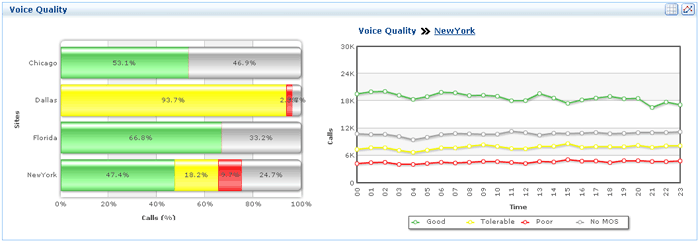
The Voice Quality graph provides the percentage distribution of the Successful calls as Good, Tolerable, Poor calls and No MOS based on the MOS value of the site. This can also be seen in graphical and tabular format. The tabular format can be toggled to graphical format (Line graph) by clicking on the graph icons present at the top right corner of the Voice Quality graph. A sample graph is shown below
Alarms
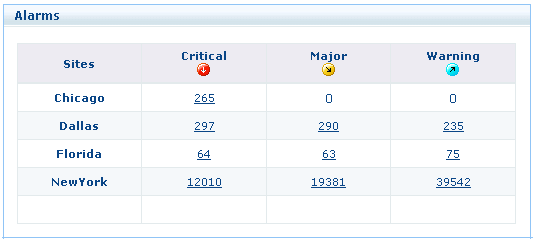
The tabular view provides the count of Critical, Major and Warning alarms generated in the corresponding sites. For configuring the alarm profiles, login into the Probe Server.
Concurrent Calls
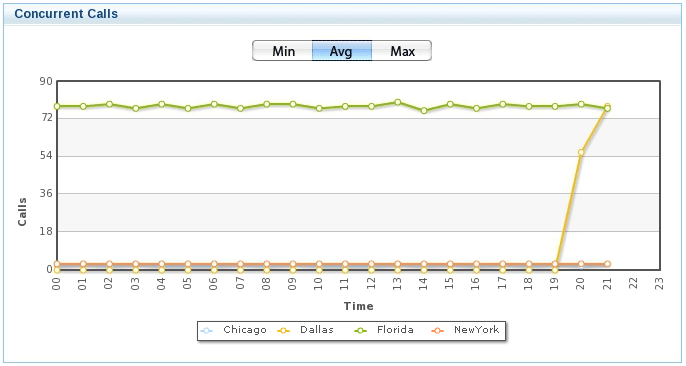
The graph depicts the hourly trend of concurrent calls for each site. The graph can also be plotted based on Minimum, Average and Maximum concurrent c
alls for each site by selecting the corresponding button present above the graph. You can also see the concurrent calls for each site individually by clicking on the icons present before the legend under the graph. Click on the corresponding sites to show/hide the graph for an individual site.
Traffic Monitor
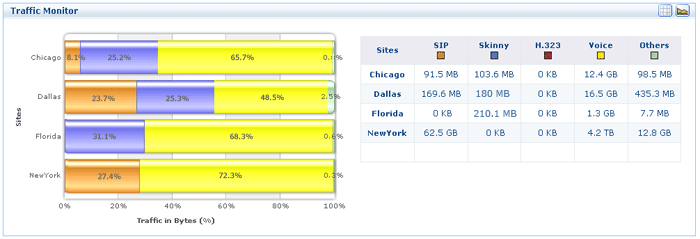
The Traffic Monitor graph provides a detailed information on the type of traffic flowing in each site. You can see the amount of bandwidth consumed by SIP/Skinny/H.323 traffic, and Voice traffic in your VoIP network. Clicking on the percentage distribution graph for any site provides the graphical representation of the bandwidth utilized by the signaling traffic and voice traffic. You can select either tabular format and graphical view by clicking on the graph icons present on the top right corner of the Traffic Monitor graph.
Some useful links
Distributed Edition | Online User Guide | Download help ZIP
We welcome your feedback and comments!! You can reach us via this Blog, or for more customized support, mail us at vqmanager-support@manageengine.com. We will be glad to assist you.
Warm Regards
Team VQManager
Website | Blogs | Twitter | Product overview | Download