Monitor your geographically distributed VoIP deployment ManageEngine releases new Distributed Edition of VQManager-version 7.0 which is highly scalable for mid and large Enterprises and Service...
VoIP industry leaning towards SIP
The latest VoIP market trends show a strong inclination towards SIP(Session Initiation Protocol). It is definitely encouraging to see the VoIP industry converge toward a...
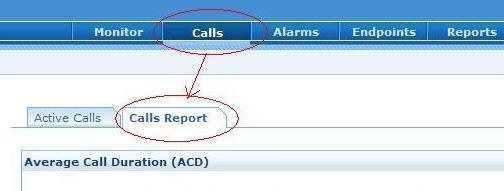
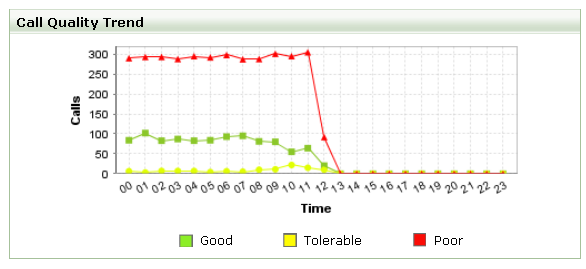
Know why VoIP calls failed or had poor quality
Today we’ll see what’s present in the all new ‘Calls Report‘ section, found under VQManager’s “call” tab. For the sake of simplicity, VQManager broadly...
What is being cooked @VQManager – Part I
While monitoring your VoIP set-up, two high priority areas to be tracked are QoS(Quality of Service) and Call drops. In our upcoming release, we have...
VQManager 6.1.1 out!!
Hey all, Hope things are fine and in the best of spirits. It’s again time for good news from our side. Get ready to shed...
Europe – ManageEngine’s next door this September!
Post the H.323 release, VQManager continues to go places and this time we are accompanying a big ManageEngine team alongside dedicated ManageEngine European partners. Mark...
Configuration Wizard with 6.1
We’ve built you a configuration wizard that’s more than just pretty. This screen appears when a user logs into VQManager for the first time. All...
Packet capture – easier now!
As we had promised, here we are with the inbuilt option to get a packet capture of your VoIP traffic for troubleshooting. If you felt...
VQManager at NXTcomm & Cisco Live
We’ve been having a great month. The latest Beta that supports the H.323 protocol has been received well by our testers and evaluators and we...