
Does this happen to you? We often hear a scenario like that from people like you who want to evaluate IT360 but are unable to...
How to Respond to IT Issues in Real Time
“IT has always been viewed as a 24/7 organization, but we haven’t had the tools to be a 24/7 organization,” said Raj Sabhlok, President of...

This Week’s Five: The Changing Role of CIOs
This Week’s Five is the column where we bring to you a collection of five interesting reads from all over the web, with a different topic...
If Big Data’s too scary, try Little Data (it’s free)
Here are some stats that will blow your mind: Every minute of every day, 48 hours of video content is uploaded to YouTube, Google receives...
Log Monitoring and Network Operations
Imagine every event occurring in the network/devices is recorded in real time, including the abnormal events. What else would you want? Obviously, a convenient way...
Why you need to integrate IT operations and IT service management
In a previous article, I wrote about the need for application-aware network performance management (AA-NPM) tools. With tools that can manage the entire range of...
5 Reasons You Should Consider Application-Aware Network Performance Management
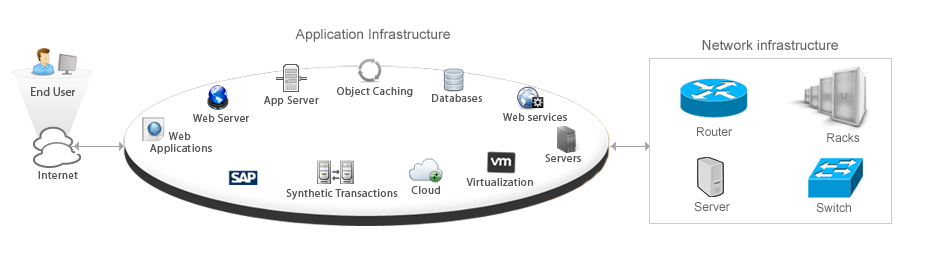
In today’s complex business environment, the first question thoughtful IT leaders ask when considering any new IT investment or change is, ‘How will it impact the business?’ That the business depends on well-managed IT is well understood. What is less well understood is how an IT organization can manage an infrastructure that is growing ever more complex. It’s not just the network infrastructure that IT teams need to consider; it’s not even the increasingly complex application infrastructure that stands between the physical network infrastructure and the users. The challenge today involves the effective management of both these infrastructures as well the interplay between them — and it’s the interplay between them that poses the greatest challenge. Application-aware network performance management (AA-NPM) tools can help you overcome that challenge. What is AA-NPM? These days, before an application appears in front of an end user, it may pass through numerous infrastructure components, as shown in the diagram below: Traditional or stand-alone application performance management (APM) tools provide visibility only into the middle component group, the application infrastructure. They typically support auto-discovery of all the applications in the networks, transaction analysis, application usage analysis, end-user experience analysis, and more. They also provide the basic functions to monitor the health and performance of all configured application infrastructure assets. But APM tools do not provide insight into the network infrastructure itself. Typically, network infrastructure managers rely on separate network performance management (NPM) tools for fault management, device monitoring, capacity planning, interface traffic analysis, configuration management and those sorts of tasks. The problem with a management approach that relies on two separate tools is that neither of these tools is designed to facilitate the management of the interplay between these environments...
5 Ways MSPs Can Maximize Their ROI and Profit
I had an opportunity to look at a few industry surveys that were designed to analyze the Managed Service Provider (MSP) market. One of the...

Change Control Automation & Better Management of Network Assets
In IT infrastructure management, integration of tools/software with one another has always been a crucial requirement. In Network Change and Configuration Management (NCCM), which predominantly...