With the need for scalability and faster application delivery, businesses today are reconsidering the platform to be used for application deployment. With vFabric tc Server, enterprise users are now provided with a lightweight Java application server combined with the swiftness of the Spring framework with mission-critical support capabilities. vFabric tc Server, a runtime server at the heart of the VMware vFabric Cloud Application Platform, is based on Tomcat with a number of crucial enhancements to it, making it suitable for enterprises.
Applications Manager monitors the critical components of the vFabric tc Server to detect any performance problems. This monitoring is carried out by tracking the memory, thread, throughput, garbage collection, etc. It delivers proactive alarm notifications, triggering appropriate actions and empowering the operators with drill-down analysis and reporting. It also provides visibility into the performance of the Spring-powered cloud applications deployed in the vFabric tc Server.
In this post, we will discuss some of the major performance metrics monitored by Applications Manager and how it helps in improving the performance of the server:
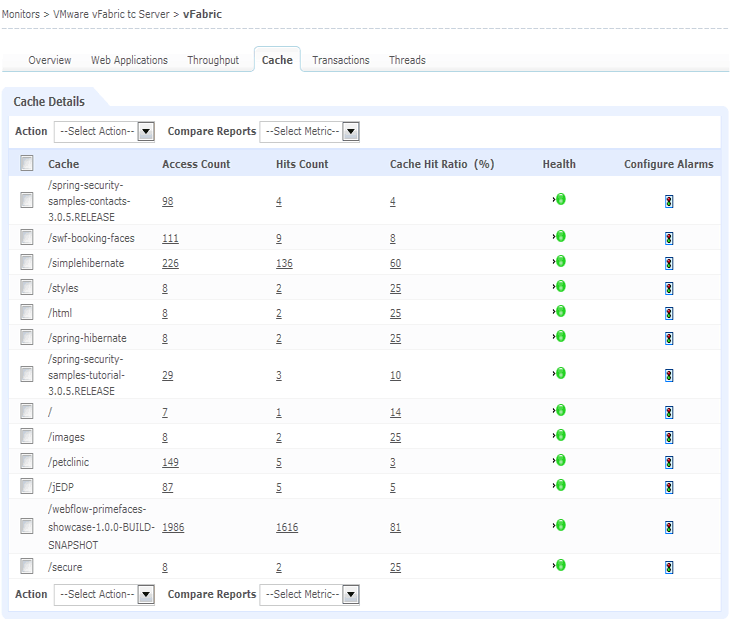
Hits Count: This parameter represents the number of times the object was accessed from the Resource Cache. Having a high cache hit ratio will avoid unnecessary JNDI look-ups, thus enhancing the performance of the application.
Session Create Rate: Monitoring this parameter will help you keep the Active Sessions count low which can in turn help in optimal usage of heap memory. If the Session Create Rate is consistently higher, then the user might want to consider invalidating the session explicitly.
Average Response Time: Increase in ‘Average response time’ is an indicator of performance degradation.
Heap Memory Graph: Consistently increasing heap memory is an indicator of memory leak which could be happening because of numerous reasons like the sockets or result set not being closed properly, any references left open or GC issues.
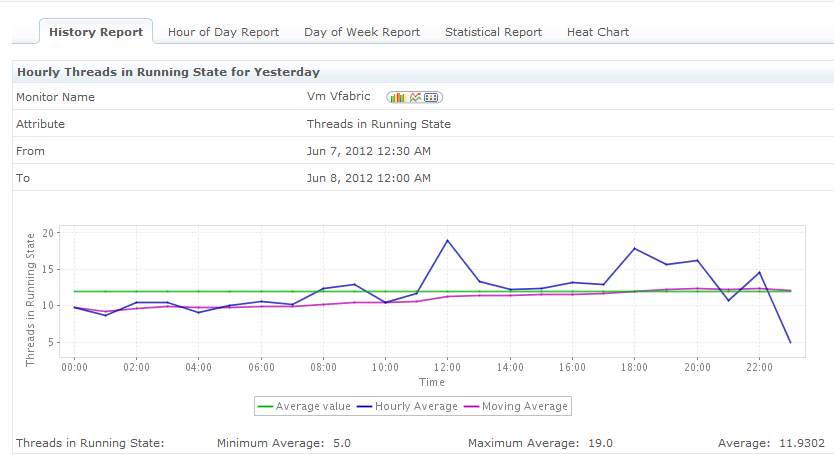
Thread Dump: If the number of busy threads spawned by tc server is too high, then there is a fair chance that the rate at which the servlet is sending the request is beyond the processing capacity of the tc server. Taking a thread dump should help in such cases.
Global Request Processor, collects request processing information like bytes received, bytes sent, processing time, from all the Request Processor threads.
Access Count: This parameter represents the number of times the resource object has been accessed.
Apart from the above metrics; Applications Manager monitors the various web applications running in the server, transactions at application level, and the JVM performance. The various metrics monitored, keep you notified on the health status, the failed transactions, when the cache hit ratio violates the threshold, and much more.
Try Applications Manager today and get deep performance insight into your VMware vFabric tc Server and the Spring-based cloud applications deployed on them.


