Organizations across industries suffer hundreds of thousands of dollars in lost revenue and reduced productivity annually due to under performing or down networks. According to a 2014 Gartner study, the average cost of a down network can be up to $5,600 per minute, which extrapolates to well over $300K per hour. These down networks and their impact on the organization are risks that are simply not worth taking.
As a network administrator, you need to select the right Network Monitoring System (NMS) that can help you quickly resolve network issues and proactively monitor network performance. The NMS features must help you avert network disasters and resolve common network problems. Ideally, the NMS or the network performance monitoring tool must provide:
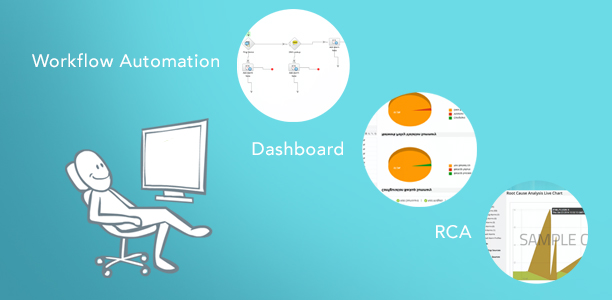
• An effective dashboard to provide instant visibility into the network’s health
• A feature to automate routine tasks
• A root cause analysis feature to isolate issues between the network and the server
Killer Feature No. 1: An effective dashboard to instantly visualize your network
At times, as a network admin, you may feel overburdened to monitor in real time several network interfaces at multiple locations. An effective dashboard will provide real-time visibility into the network and help you identify issues instantly. It should provide real-time views, including geographical map views, logical architecture views, and server rack views (to visualize the data center).
This information will definitely help IT admins understand faults from a higher level. For example, if a switch port reports high bandwidth utilization, you’ll need to analyze the live utilization statistics for that port. To do that, network admins ping via the command-line interface to check the status of network devices. On the other hand, if your dashboard provides real-time views of the network, you’ll be able to visualize the devices and interfaces immediately. These real-time graphs on your dashboard also provide detailed information about the network performance and its health.
A dashboard that lists the top 10 high bandwidth or high CPU utilization devices helps you prioritize the devices or servers that must be monitored. This way, you can reduce the turnaround time of identifying network or device issues long before your boss or an end user calls.
Killer Feature No. 2: A fault remediation feature to automate routine tasks
Do you need to perform routine tasks while resolving network faults or as part of maintenance tasks? A fault remediation feature can help you automate the first-level troubleshooting and repetitive maintenance tasks. You can easily embed external scripts or automate workflows when a network fault occurs either as part of ongoing maintenance tasks or on an ad hoc basis.
These scripts can be run periodically to check for faulty network connections or to monitor other network health parameters, such as high CPU usage or a dropped virtual private network (VPN) connection. The automated workflows or embedded external scripts can perform several tasks, ranging from sending notification messages and checking other status indicators to shutting down low-priority tasks. If required, they can also change the router configuration, reducing the mean time to repair (MTTR).
A fault remediation feature can inherit the IT infrastructure best practices and utilize a proven method to handle incidents and problems. In addition, a workflow automation feature can help you substantially reduce support activities and the related operational costs. This way, a fault remediation feature can decrease help desk callouts and improve the overall customer experience.
Killer Feature No. 3: A root cause analysis (RCA) feature to identify problem areas
While dealing with recurrent network issues,isolating the server or network related issues can help you resolve the tickets quickly.The root cause analysis (RCA) feature helps you do just that.For example, most times if an application slows down, the network is blamed. However, an application may slow down due to other reasons such as faulty configuration changes, server backups occurring during production hours, slow response from database servers, or due to packet losses on the network. In such cases, you need to gain clarity to isolate the issues between the network and the server.
An RCA feature is essential to determine if the application slowed down because of the server or the network. It can help you isolate network or server-related problems by correlating the alerts coming in from the network and server monitoring devices.RCA accelerates troubleshooting by providing useful insight. It also establishes a standard set of cause and effect relationships between the different elements in the network and minimizes downtime.
With the plethora of NMS tools available on the market, it is important to assess their features carefully before you select one for your organization.Therefore, make sure you pick a robust NMS that offers a lot more than just the standard set of features.Remember to check if your tool packs in all these killer features to slay your network downtime issues.
Great Blog Amrutha.
Everyday we waste so much time to just know what is wrong .
Features like these would drastically improve our response to connectivity problems.
I specially like RCA part , every time we do RCA we forget what all we checked to find issue.
if its Feature it means its stored so we can repeat it again and improve to great extent.
Great feature in any Dashboard tool